Overview
Every Medicare patient admitted to a skilled nursing facility comes with a payment attached — and that payment is determined by what's wrong with them, not how much therapy they receive. The Patient-Driven Payment Model (PDPM) is the CMS payment system that has governed SNF Medicare reimbursement since October 2019. The PDPM tab on the Skilled Nursing Analyze page shows you the clinical category breakdown for a specific SNF: how many of their Medicare stays fall into each category, how long those stays last on average, and what Medicare pays for them. For a sales rep, the PDPM tab is the financial profile of a facility — the data that tells you which patients are worth pursuing and how to have a value-based care conversation.
 In this Article
Where to Find the PDPM Tab
|
The PDPM tab is part of the Skilled Nursing Analyze page. Most of the time, you will navigate to the Skilled Nursing Analyze page when you click on the name of a facility and navigate directly. You can also click on the Recent Providers icon If you click on the "Analyze" button in the left navigation, the most recent Analyze page you have opened will be opened again. |
 |
Click on the PDPM tab near the top of the page to see the contents under the tab.

What Is PDPM?
Before October 2019, Medicare paid skilled nursing facilities based on how much therapy a patient received — the more therapy, the higher the payment. That model (called RUG-IV) created incentives to over-provide therapy regardless of patient need.
Under the PDPM, payment is based on the patient — their primary diagnosis, functional status, and clinical complexity — not how many minutes of therapy they receive. A patient with a major joint replacement is classified into a higher-paying category not because of what the facility does for them, but because of the clinical resources that type of patient typically requires.
Each patient stay is assigned to one of ten clinical categories at admission. The category determines the payment rate. Longer stays in high-complexity categories generate significantly more revenue than shorter stays in lower-complexity categories.
![]() The PDPM tab tells you what kinds of patients the selected facility is caring for, and what those patients are worth financially. That's the foundation of a referral strategy conversation with any hospital or physician practice.
The PDPM tab tells you what kinds of patients the selected facility is caring for, and what those patients are worth financially. That's the foundation of a referral strategy conversation with any hospital or physician practice.
Understanding the Metrics
PDPM Summary
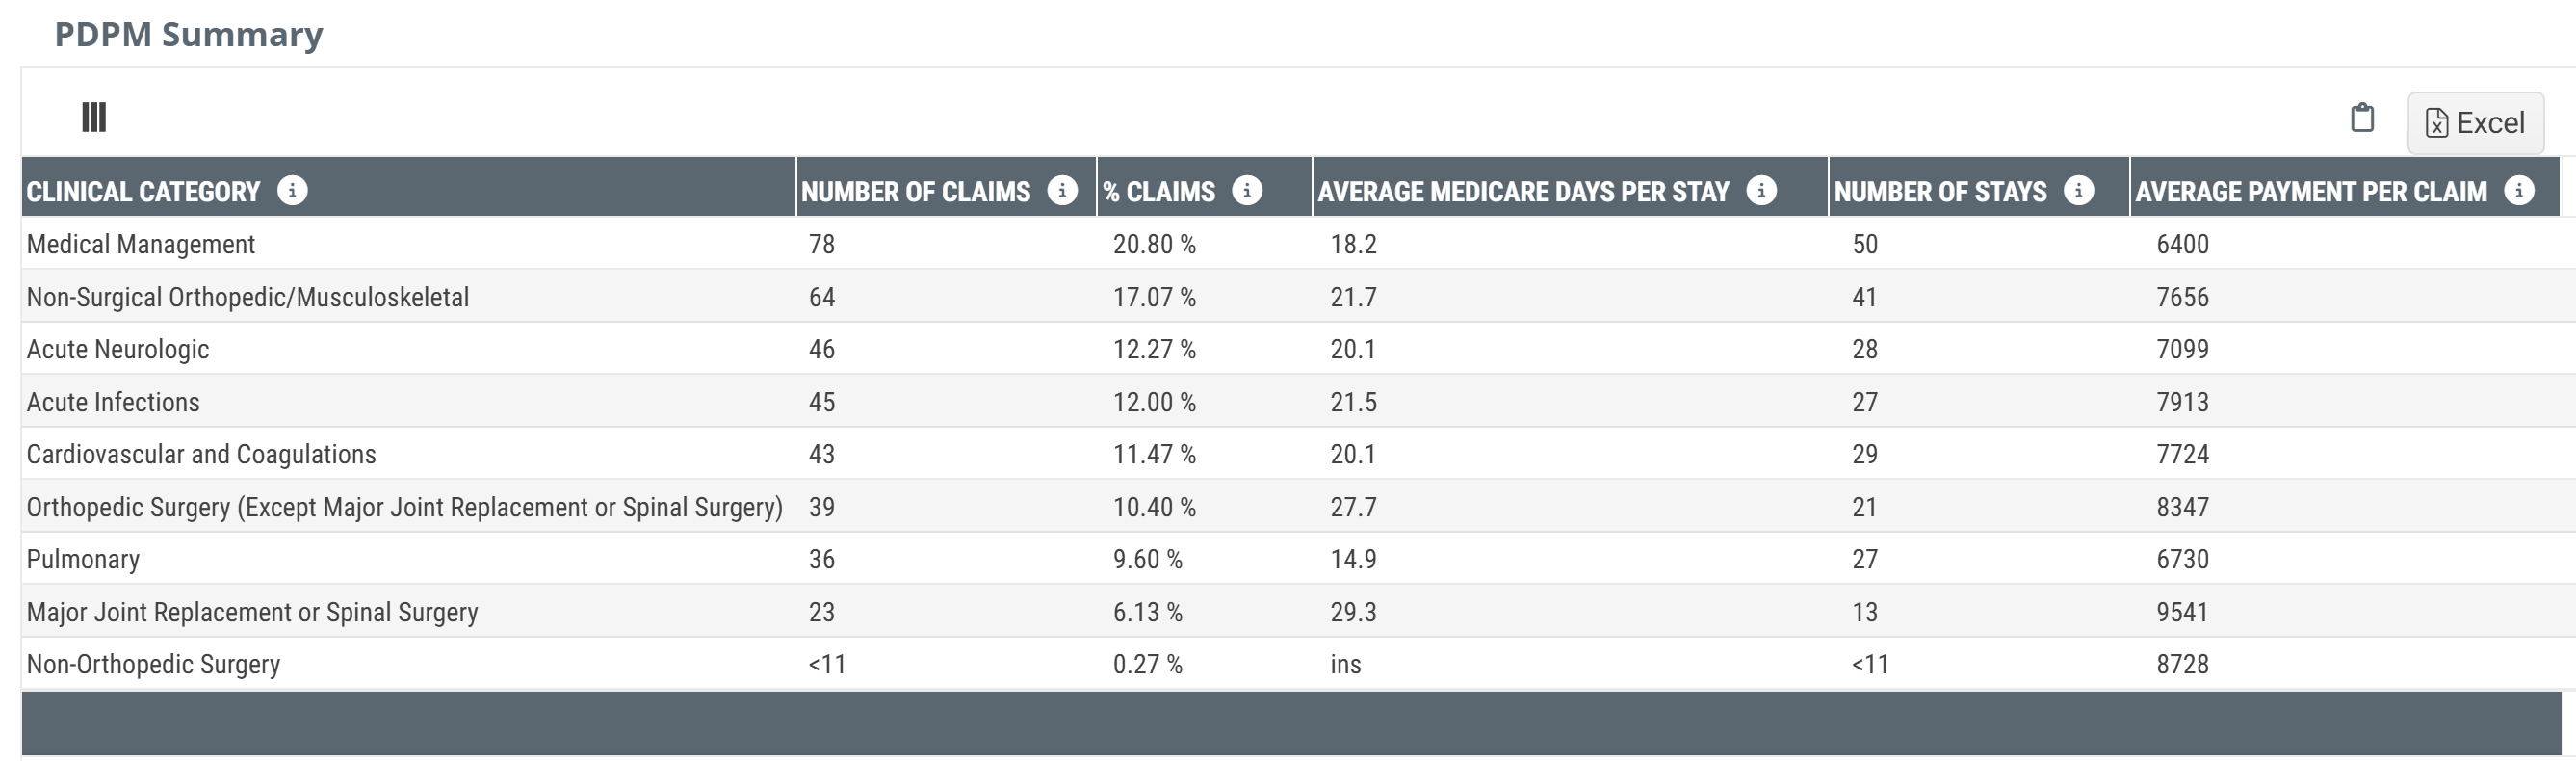
![]() The PDPM Summary table has one row for each of the ten clinical categories. Each row tells you how many Medicare stays at the selected skilled nursing facility fall into the listed category, how long those stays last on average, and what Medicare pays for them.
The PDPM Summary table has one row for each of the ten clinical categories. Each row tells you how many Medicare stays at the selected skilled nursing facility fall into the listed category, how long those stays last on average, and what Medicare pays for them.
| Clinical Category | Typical Patient Population |
|---|---|
| Non-Surgical Orthopedic / Musculoskeletal | Fractures, joint conditions, and orthopedic conditions not involving surgery |
| Acute Neurologic | Stroke, brain injury, spinal cord injury, Parkinson's, and other neurologic conditions |
| Medical Management | Complex medical conditions without a dominant surgical or neurologic diagnosis — often multi-system or medically fragile patients |
| Cardiovascular and Coagulations | Heart failure, cardiac conditions, and coagulation disorders |
| Orthopedic Surgery (Excl. Major Joint/Spinal) | Surgical orthopedic cases that are not major joint replacements or spinal surgery |
| Major Joint Replacement or Spinal Surgery | Total knee, total hip, and major spinal surgery — the highest-paying PDPM category |
| Pulmonary | COPD, pneumonia, and other primary pulmonary conditions |
| Acute Infections | Septicemia, wound infections, urinary tract infections, and similar conditions |
| Cancer | Oncology patients receiving SNF-level care |
| Non-Orthopedic Surgery | Surgical patients whose primary diagnosis is not orthopedic in nature |
![]() Category assignment is based on the patient's primary diagnosis at admission as coded on the MDS (Minimum Data Set) assessment. Coding accuracy at the hospital affects which category a patient lands in at the SNF. Mismatched or incomplete discharge diagnoses from the referring hospital can result in a patient being classified into a lower-paying category than their clinical complexity warrants — a gap that some SNF clinical teams actively work to address.
Category assignment is based on the patient's primary diagnosis at admission as coded on the MDS (Minimum Data Set) assessment. Coding accuracy at the hospital affects which category a patient lands in at the SNF. Mismatched or incomplete discharge diagnoses from the referring hospital can result in a patient being classified into a lower-paying category than their clinical complexity warrants — a gap that some SNF clinical teams actively work to address.
Number of Claims
![]() Definition
Definition
The count of Medicare FFS SNF claims submitted for stays classified into the listed PDPM clinical category during the one-year reporting period.
![]() Details
Details
A single patient stay can generate more than one Medicare claim. Medicare Part A is billed in intervals, and a stay that spans multiple billing periods will appear as multiple claims. As a result, the Number of Claims for a given category will almost always be equal to or greater than the Number of Stays — with the gap widening in longer-stay categories like Non-Orthopedic Surgery. When comparing facilities, % Claims is the more meaningful denominator because it accounts for this billing structure and reflects actual revenue-generating activity.
% Claims
![]() Definition
Definition
The percentage of the selected facility's total Medicare FFS SNF claims that align with the listed clinical category.
![]() Calculation
Calculation
% Claims = (Number of Claims in Category ÷ Total Claims across all Categories) × 100
Example: If an SNF submits 500 total Medicare claims and 195 of them are for Non-Surgical Orthopedic patients, their Non-Surgical Orthopedic % Claims = 195 ÷ 500 × 100 = 39%.
![]() Value
Value
The percentage of claims metric alerts you to the clinical specialty mix of a given skilled nursing facility — what kind of facility it actually is, regardless of what the facility markets itself as. A facility with 39% Non-Surgical Orthopedic and 7% Major Joint Replacement is a very different facility from one where those numbers are reversed.
Average Medicare Days per Stay
![]() Definition
Definition
The average number of Medicare-covered days spent in the selected skilled nursing facility during the one-year reporting period for patients who were classified into the listed PDPM clinical category.
![]() Details
Details
Average Medicare Days per Stay reflects both the complexity of the patient population and the SNF's clinical approach to that population. High-acuity categories like Non-Orthopedic Surgery (80.6 days in the example below) have much longer stays than lower-acuity categories like Cancer (25.9 days). Stays longer than 100 days exhaust Medicare Part A benefits, at which point payment responsibility shifts.
Longer stays mean more total revenue per admission, but they also mean the bed is occupied longer. For a SNF managing capacity, a mix of long-stay and shorter-stay admissions is often preferable to all long-stay.
Number of Stays
![]() Definition
Definition
The count of SNF stays that were classified into the listed PDPM clinical category and processed during the one-year reporting period.
![]() Details
Details
A number of stays metric counts unique patient admissions — one stay per patient admission, regardless of how many claims that stay generated. This makes the number of stays a cleaner measure of patient volume. Number of claims will almost always be higher than number of stays for the same category, because longer stays generate more billing intervals. Use number of stays when you want to know how many patients of a given type the SNF actually admitted; use number of claims when you want to understand billing activity and revenue patterns.
Average Payment Per Claim
![]() Definition
Definition
The average Medicare reimbursement for Medicare FFS SNF claims that were classified into the listed PDPM clinical category and processed during the one-year reporting period.
![]() Details
Details
Payment amounts vary significantly across categories. The table below illustrates the range observed at one example skilled nursing facility:
| Clinical Category | Avg Medicare Days per Stay | Avg Payment Per Claim |
|---|---|---|
| Major Joint Replacement or Spinal Surgery | 49.2 | $9,943 |
| Acute Neurologic | 39.2 | $5,037 |
| Non-Surgical Orthopedic / Musculoskeletal | 38.6 | $4,701 |
| Pulmonary | 31.6 | $4,606 |
| Orthopedic Surgery (Excl. Major Joint/Spinal) | 33.4 | $4,064 |
| Acute Infections | 33.7 | $3,609 |
| Cardiovascular and Coagulations | 35.3 | $3,597 |
| Medical Management | 32.2 | $2,856 |
| Non-Orthopedic Surgery | 80.6 | $2,947 |
| Cancer | 25.9 | $2,479 |
![]() These figures are drawn from a specific SNF in Trella's training environment and are provided to illustrate the range of values. Figures for the facility you are reviewing will differ.
These figures are drawn from a specific SNF in Trella's training environment and are provided to illustrate the range of values. Figures for the facility you are reviewing will differ.
The Average Payment Per Claim metric reflects only Medicare FFS reimbursement. PDPM rates are also adjusted for geographic wage differences and individual patient case-mix complexity. The figures shown are averages — individual claim payments vary based on the patient's specific functional scores, comorbidities, and other PDPM payment components.
![]() Trella's numbers may differ from what an SNF's own billing team reports. Trella uses CMS Medicare FFS claims data, which reflects submitted and adjudicated claims. Internal billing systems may use different calculation periods or include adjustments not reflected in claims data.
Trella's numbers may differ from what an SNF's own billing team reports. Trella uses CMS Medicare FFS claims data, which reflects submitted and adjudicated claims. Internal billing systems may use different calculation periods or include adjustments not reflected in claims data.
Using the PDPM Data
![]() Evaluate the selected skilled nursing facility
Evaluate the selected skilled nursing facility
Start by looking at % Claims to understand what kind of facility you are working with. A facility where non-surgical orthopedic / musculoskeletal makes up 38–40% of claims is a post-acute orthopedic facility — its beds, staffing, and therapy programs are built for that population. A facility with a high acute neurologic percentage has built clinical competency around stroke and brain injury recovery.
Compare average payment per claim across categories to understand where the facility's revenue is concentrated. Major Joint Replacement generates the highest average payment in most SNF profiles. If a facility has a low % of Major Joint claims despite being near a hospital with a high joint replacement volume, that is a gap worth exploring.
![]() Questions
Questions
The PDPM data helps you answer:
- What clinical populations does this SNF actually specialize in?
- Which of my hospital's patient types would bring the most revenue to this SNF?
- Is this SNF capturing the high-value surgical patients from nearby hospitals, or are competitors getting them?
- What is the revenue difference if we shift more Major Joint Replacement patients to this facility?
![]() Connections
Connections
The PDPM tab works alongside other SNF data to build a complete picture:
- CMS TEAM — The Transforming Episode Accountability Model covers five surgical episode categories (CABG, Lower Extremity Joint Replacement, Major Bowel Procedure, Spinal Fusion, Surgical Hip/Femur Fracture) that map directly to the Major Joint Replacement and Non-Orthopedic Surgery PDPM categories. An SNF with a strong PDPM profile in these categories has a natural value story for CMS TEAM hospitals.
![]() For more information on TEAM metrics in Trella Insights, see TEAM in Trella Insights.
For more information on TEAM metrics in Trella Insights, see TEAM in Trella Insights.
- Highest Readmission Rate MS-DRGs — Also in Skilled Nursing Analyze, this table shows which MS-DRGs at a nearby hospital have the highest readmission rates. Cross-referencing MS-DRG patterns with the SNF's PDPM category mix helps identify where a specific SNF can address a specific hospital's outcome problem.
- Facility Analyze - Sales Spotlight — "How Do I Stand Out?" in the Sales Spotlight tab lets you compare your SNF against competitors on outcome metrics for the same patient population. Once you know which PDPM categories your facility leads in, the Sales Spotlight tab helps you prove it.