Overview
![]() The Insights tab on the Skilled Nursing Analyze page displays some of the most critical metrics for evaluating the selected skilled nursing facility. This article will include metric definitions and usage insights for each tile on the page.
The Insights tab on the Skilled Nursing Analyze page displays some of the most critical metrics for evaluating the selected skilled nursing facility. This article will include metric definitions and usage insights for each tile on the page.

![]() For a complete overview of the tools and features on the Analyze page, see The Analyze page.
For a complete overview of the tools and features on the Analyze page, see The Analyze page.
 In this article
The Insights tab
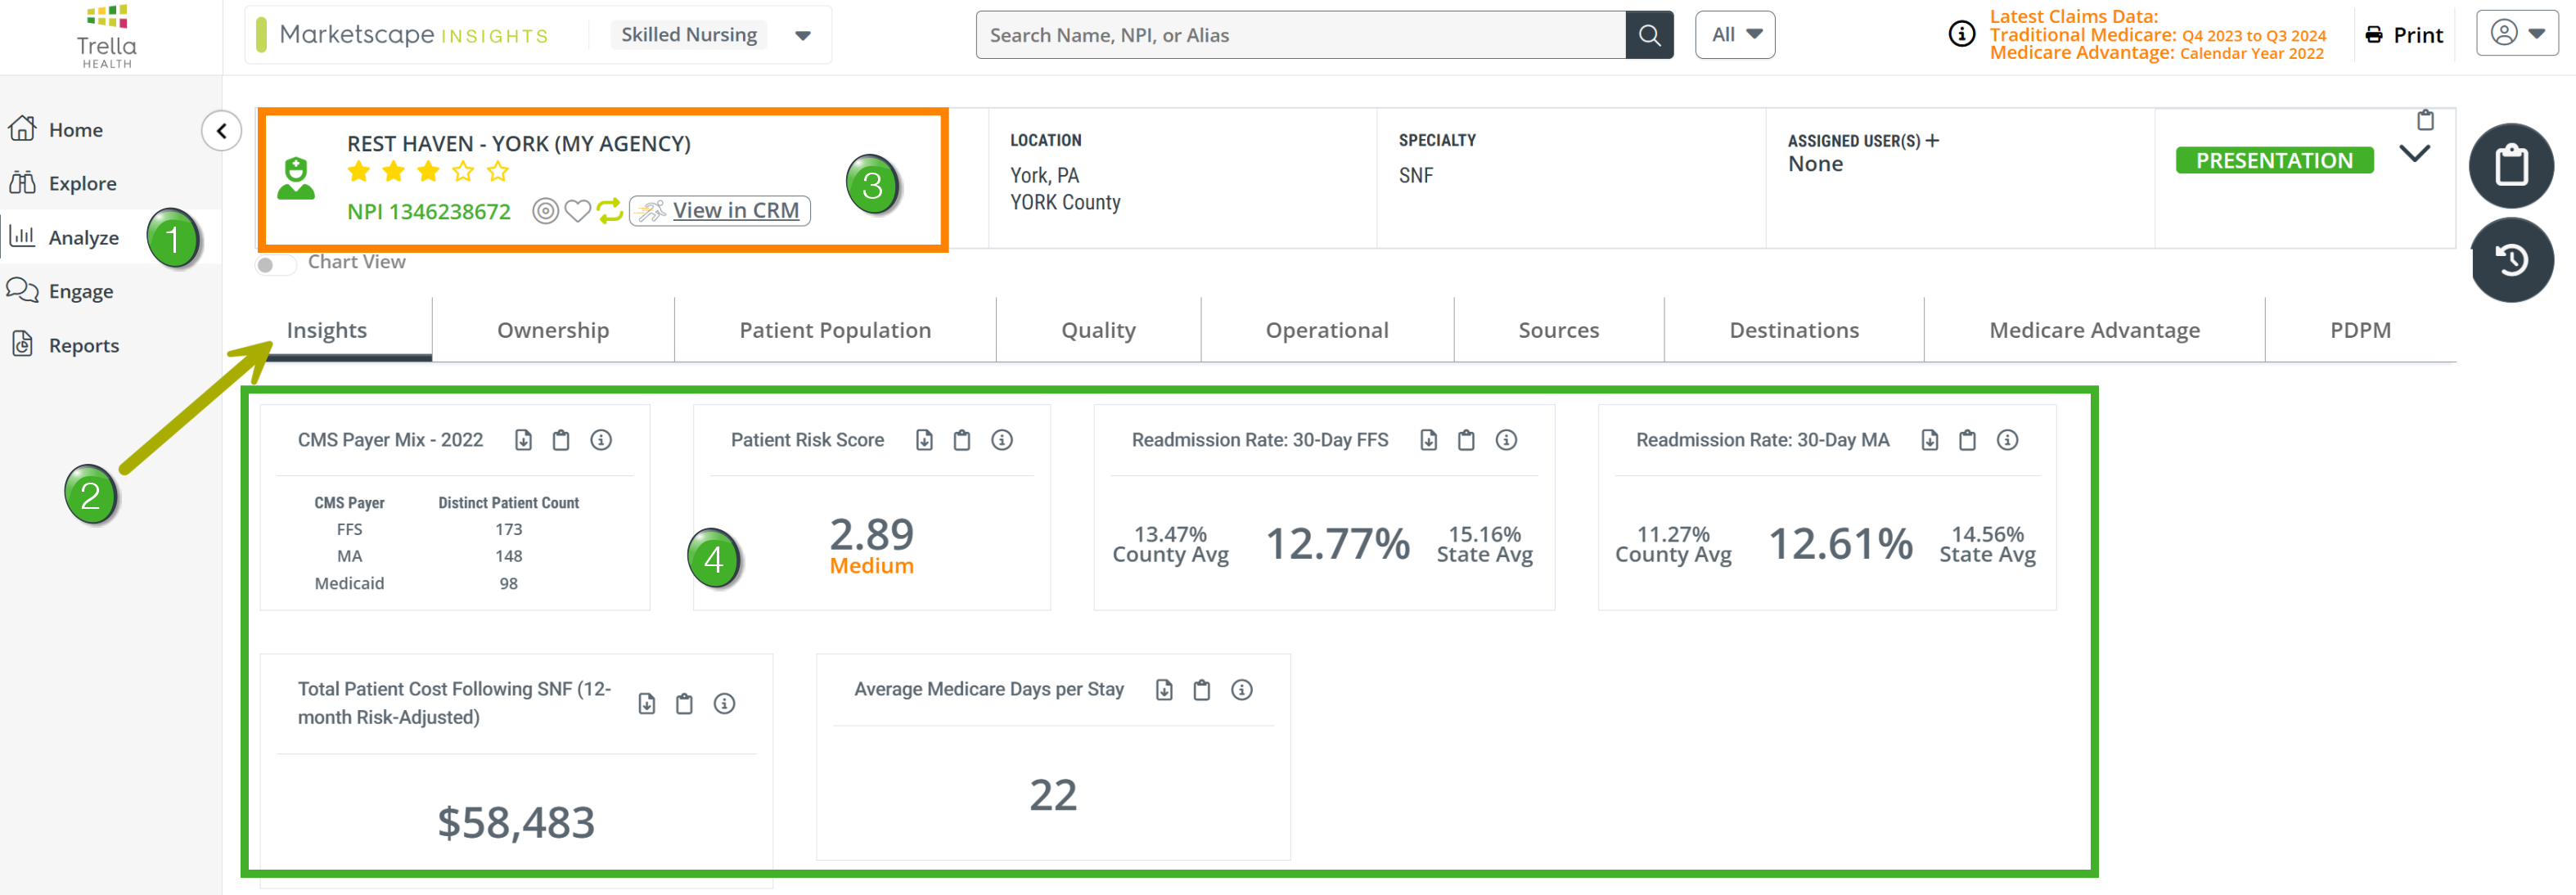
![]() Use the following image as a quick orientation to the Insights tab on the Skilled Nursing Analyze page.
Use the following image as a quick orientation to the Insights tab on the Skilled Nursing Analyze page.
![]() Navigate to the Analyze page - there are a few ways to navigate to an Analyze page.
Navigate to the Analyze page - there are a few ways to navigate to an Analyze page.
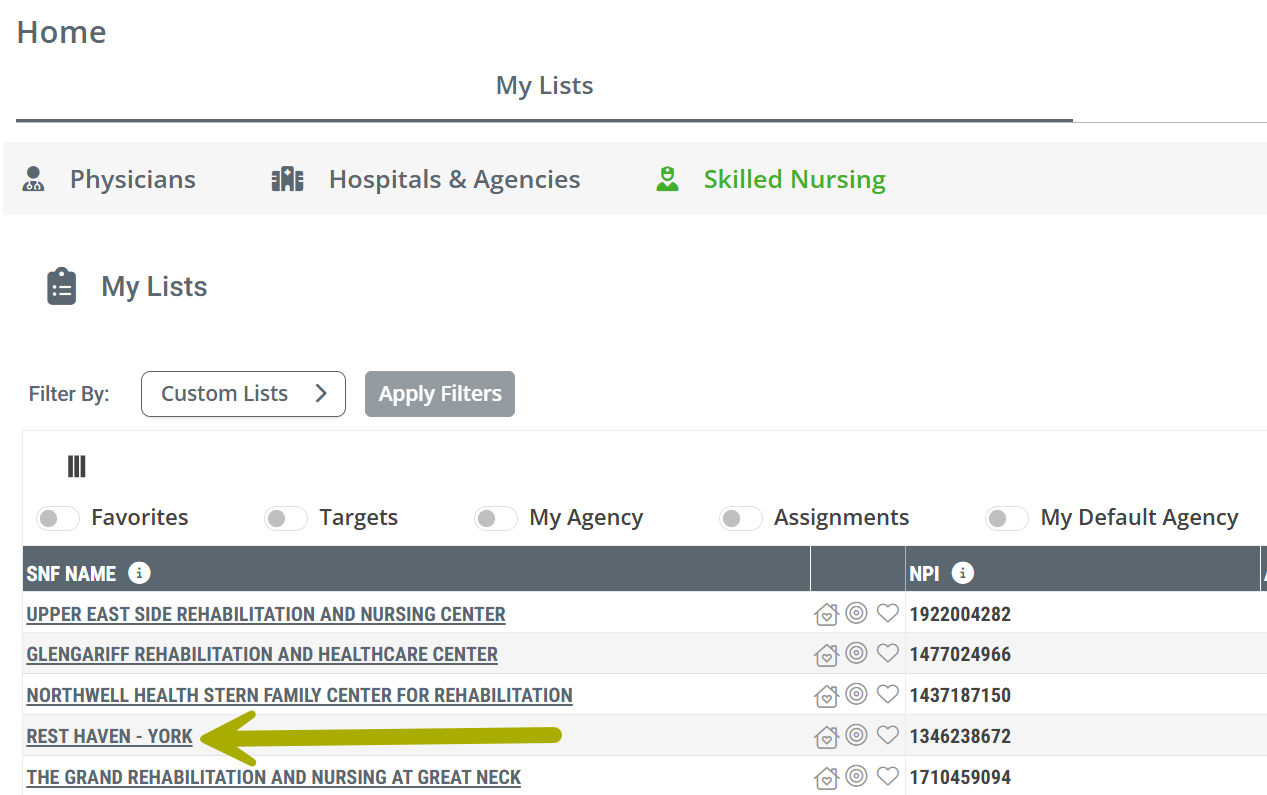
- Provider Links - In most tables throughout Trella Insights, every listed provider name is a link to the Analyze page for that provider. This feature can be found in the tables on every page. The image below shows the link to our sample skilled nursing facility on the Home page
- Click the link to open the Analyze page.
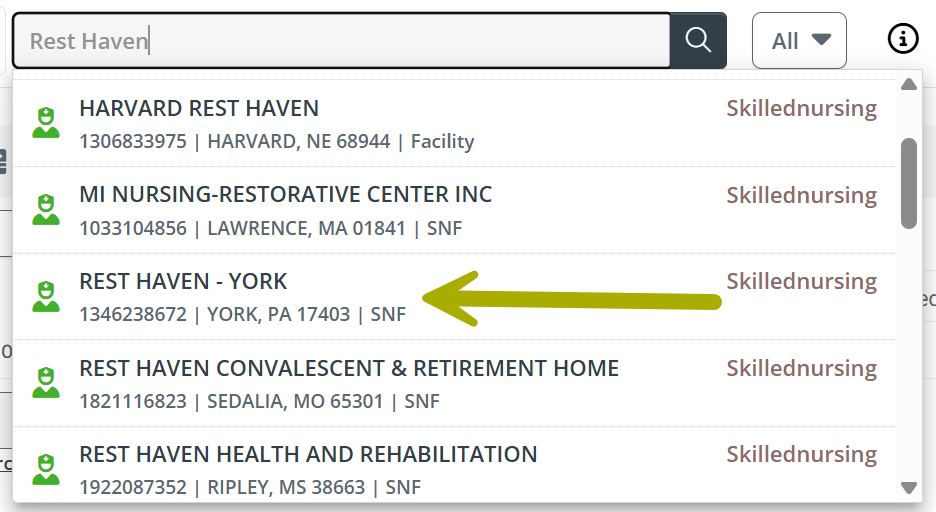
- Global Search - At the top of every page in Trella Insights is a search field that can be used to find any provider. The image show a search for "Rest Haven," the sample provider used in this article. We needed to scroll down a bit to find it.
- Click on the provider in the list to open the Analyze page.
-
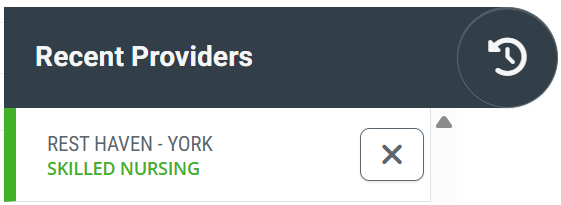
Recent Providers - If you have viewed a specific provider recently, click on the Recent Providers button at the top right of the page -
 . A list of providers you have viewed recently will open. The image shows the sample provider we are using for this article.
 - Click on the provider you want to open. The Analyze page will open.
![]() Insights tab - Click on the Insights tab at the far left of the row of tabs. This is the default tab, so it will most likely be open when you navigate to the Analyze page as shown above.
Insights tab - Click on the Insights tab at the far left of the row of tabs. This is the default tab, so it will most likely be open when you navigate to the Analyze page as shown above.
![]() Selected skilled nursing facility - The selected skilled nursing facility is shown at the top of the page. Tables and metrics shown under every tab on the Skilled Nursing Analyze page pertain to the selected facility.
Selected skilled nursing facility - The selected skilled nursing facility is shown at the top of the page. Tables and metrics shown under every tab on the Skilled Nursing Analyze page pertain to the selected facility.
![]() For more information, see Provider Information.
For more information, see Provider Information.
![]() The Metrics - There are six tiles that show the Insights metrics for the selected skilled nursing facility. Descriptions of the metrics are found below.
The Metrics - There are six tiles that show the Insights metrics for the selected skilled nursing facility. Descriptions of the metrics are found below.
Understanding the Metrics
![]() All metrics under the Insights tab are used to evaluate the performance of the selected skilled nursing facility. For each tile on the page, we provide some basic usage information along with a definition of each metric, a metric calculation, and other locations to find the metric.
All metrics under the Insights tab are used to evaluate the performance of the selected skilled nursing facility. For each tile on the page, we provide some basic usage information along with a definition of each metric, a metric calculation, and other locations to find the metric.
CMS Payer Mix - 20XX
 Using this metric
![]() Evaluate
Evaluate
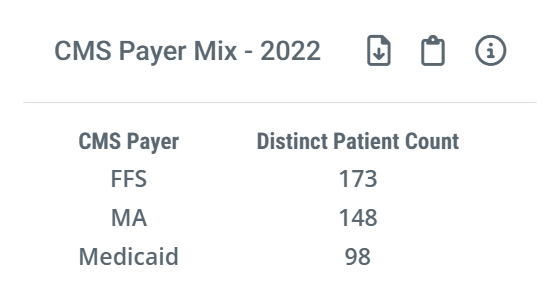
This tile allows you to view the payer mix for the selected skilled nursing facility so you can identify whether they are a good fit for your organization. For example, if you want to target FFS patients, or Medicare Advantage patients, you can qualify a referral source by viewing their payer mix here.
![]() Compare
Compare
The included metrics allow you to compare patient counts for the selected SNF for these three payer types:
- FFS - Medicare Fee for Service
- MA - Medicare Advantage
- Medicaid
![]() In order to provide a meaningful comparison between the three different payer types, we display counts from the most recent year for which all three payers have complete counts available. CMS releases complete Medicare Advantage data two years after the reporting quarter is closed. We make counts for Medicare FFS and Medicaid for the same period to provide a meaningful comparison.
In order to provide a meaningful comparison between the three different payer types, we display counts from the most recent year for which all three payers have complete counts available. CMS releases complete Medicare Advantage data two years after the reporting quarter is closed. We make counts for Medicare FFS and Medicaid for the same period to provide a meaningful comparison.
 Understanding the Metric
 Definition
The three metrics displayed are counts of distinct patients treated by the selected skilled nursing facility during the one year reporting period based on claims for each claim type.
 Where can I find this metric?
These metrics are not displayed anywhere else in Trella Insights for Skilled Nursing nor in Trella CRM. They only apply to the selected SNF and are placed in Insights to contribute to an evaluation of the SNF.
Patient Risk Score
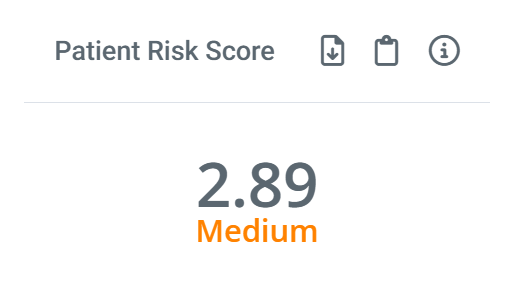
Risk Scores provide insights into the amount of care that can be expected for the patient population treated by the listed provider, and it helps calibrate a provider’s performance relative to its peers.
![]() For more information, see Risk Scores and HCC.
For more information, see Risk Scores and HCC.
Where can I find this metric?
Trella Insights
- On the Explore page in the row for the selected skilled nursing facility.
Readmission Rate: 30-Day FFS and MA
Calculated from Medicare FFS claims data |
Calculated from Medicare Advantage claims data |
 |
 |
Using these metrics
![]() Evaluate
Evaluate
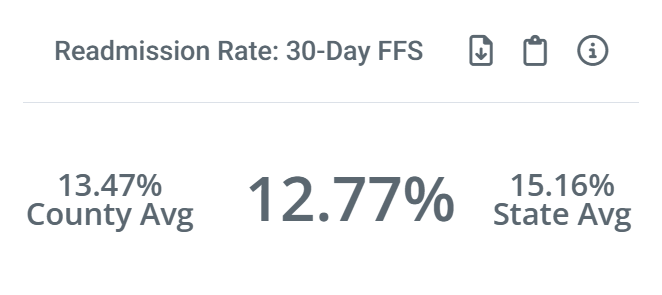
Hospitals are penalized for high readmission rates. If you can show a hospital that your skilled nursing facility has a history of care that keeps readmission rates down, you are more likely to receive patient referrals from that hospital.
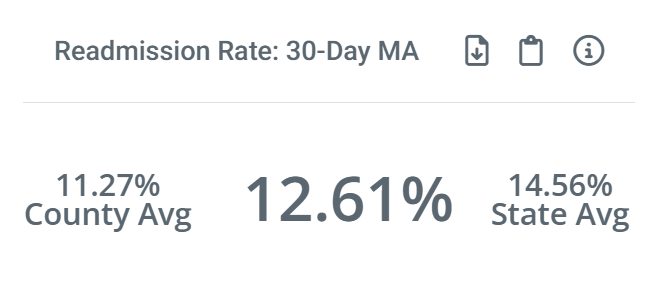
The metrics on the two tiles are calculated the same way. This is also true for the county and state benchmarks.
Understanding the Metrics
![]() Definition
Definition
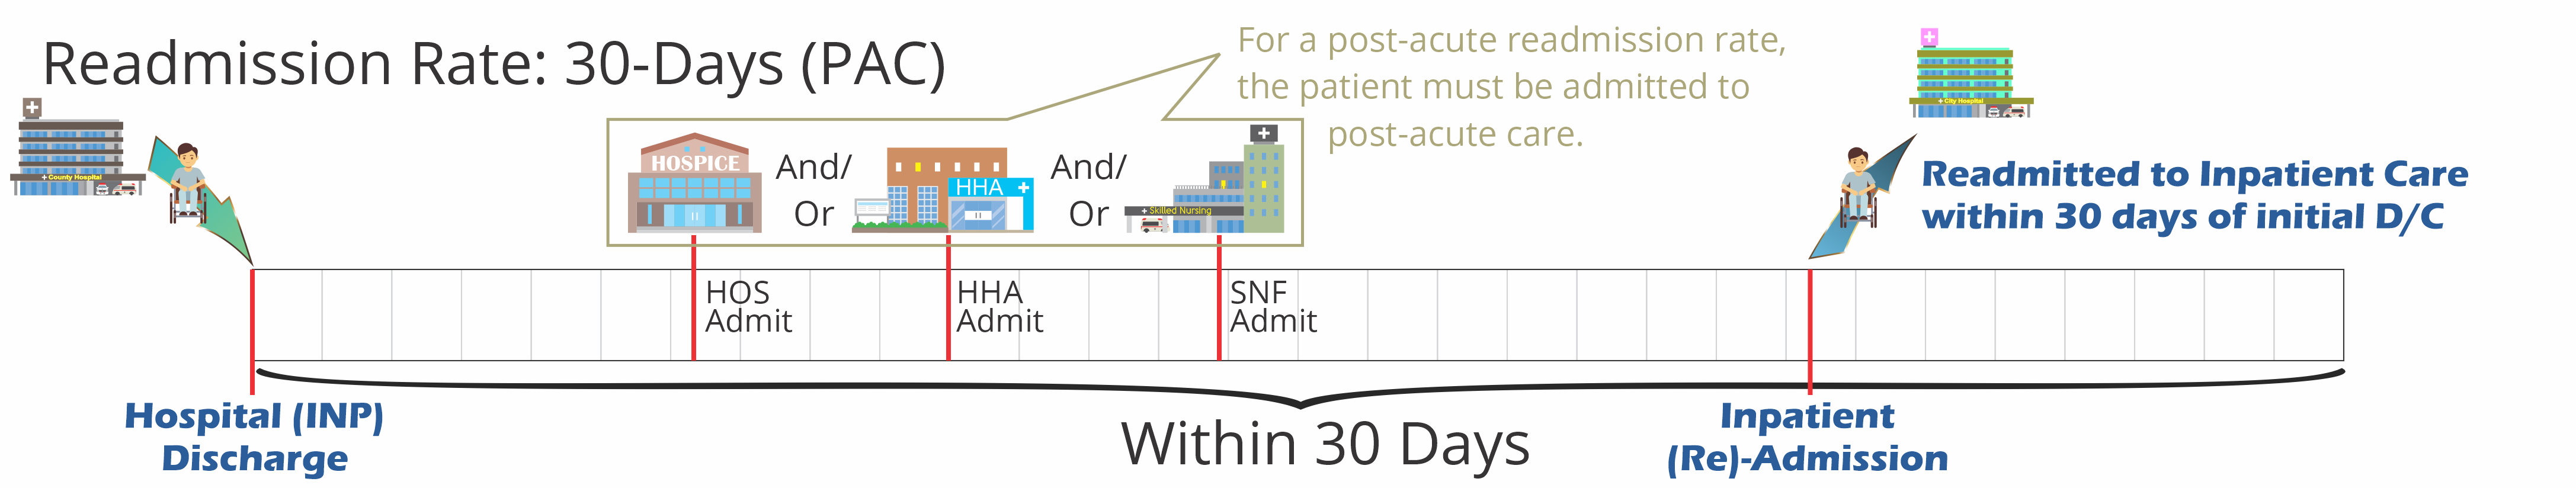
A readmission is a care event where a patient is admitted to any inpatient stay within 30 days of being discharged from a previous inpatient stay - this is the baseline for understanding a readmission and calculating a readmission rate.
The metric displayed on the Readmission Rate: 30-Day FFS tile is calculated specifically for the selected skilled nursing facility. This metric is calculated by using a count of readmission patients admitted to the selected facility during the 30 day period.
![]() Calculation
Calculation
The readmission rate for the selected skilled nursing facility is the percentage of readmission patients who were admitted to the selected facility. The equation would look like this:

![]() For more details, see Inpatient versus post-acute readmission rates
For more details, see Inpatient versus post-acute readmission rates
![]() Details
Details
The Readmission Rate tile also displays the state and county benchmark metrics for comparison. The readmission rates are averages of readmission rates for all skilled nursing facilities in the same county and state as the selected facility.
A quick comparison of the metrics will reveal if the selected facility performs better than its peers at the county or state level.
![]() Where can I find these metrics?
Where can I find these metrics?
In addition to the Insights tab on the Skilled Nursing Analyze page, additional Medicare FFS Readmission Rate metrics for the selected skilled nursing facility can be found:
- On the Skilled Nursing Explore page in the row for the selected facility in the column for Readmission Rate: 30-Day
- On the Skilled Nursing Analyze page, under the Quality tab, the Trended Readmission Rates table contains 30, 60, and 90 day trended rates
- On the Skilled Nursing Analyze page, under the Quality tab, the BPCI Groups table has 30, 60, and 90 day readmission rates broken out by BPCI groups
- On the Skilled Nursing Analyze page, under the Quality tab, the Readmission Rates table includes readmission rates broken out by Trella Health Diagnostic group by acuity
- On the Skilled Nursing Analyze page, under the Operational tab, the SNF's Summary table includes four readmission metrics for the selected skilled nursing facility
Additional Medicare Advantage metrics can be found on the Medicare Advantage tab.
Total Patient Cost Following SNF (12-Month Risk-Adjusted)
Using this metric
![]() Evaluate
Evaluate
Lower overall costs is a signature objective in the world of value based care. This metric provides an average cost per patient for patients treated by the selected skilled nursing facility.
Understanding the Metric
![]() Definition
Definition
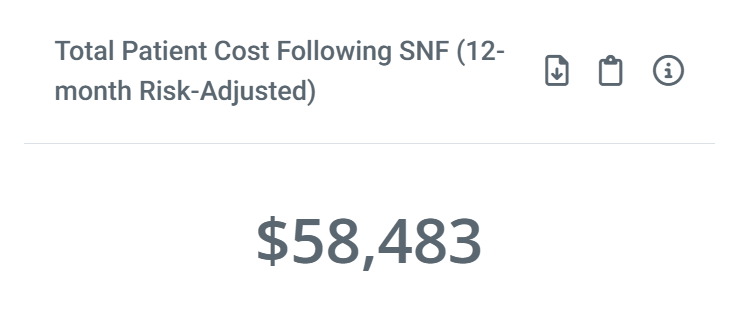
The dollar amount on the tile is the average patient spend for patients admitted to the selected skilled nursing facility from start of care through the following year. The patient population for this metric includes patients admitted to the selected facility during the one year reporting period.
![]() Calculation
Calculation
For this calculation, we sum the cost for all patients admitted to the selected skilled nursing facility during the one year reporting period, for the one year period after admission and then divide that total cost for all patients by the number of patients to get an mean average.
![]() Where can I find this metric?
Where can I find this metric?
The best way to really dig in on patient costs is to navigate to the Reports page and look at the tables under the Total Patient Cost tab. You can also then compare your facility to competitors of interest.
![]() For more information, see Reports - Total Patient Cost.
For more information, see Reports - Total Patient Cost.
Average Medicare Days per Stay
Understanding the Metric
![]() Definition
Definition
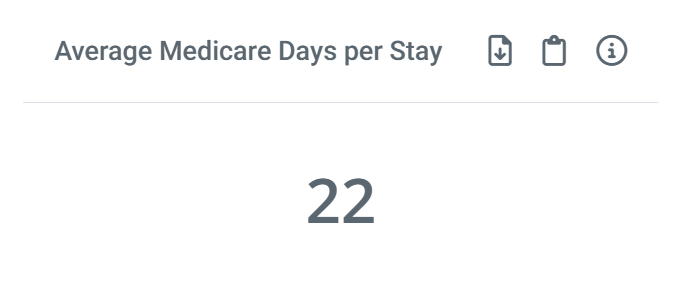
The average number of patient days spent in the selected skilled nursing facility
![]() Calculation
Calculation
Add up the number of total patient days and divide by the number of patients.
![]() Where can I find this metric?
Where can I find this metric?
In addition to the Skilled Nursing Analyze page, under the Insights tab, this metric can be found:
- On the Explore page, in the row for the selected skilled nursing facility, in the column, Average Medicare Days per Stay.
- On the Skilled Nursing Analyze page, under the Quality tab, in the Length of Stay by Trella Diagnostic Groups table, average Medicare days metrics are broken out by Trella Health Diagnostic groups. In addition, median averages are included.
- On the Skilled Nursing Analyze page, under the Quality tab, in the Length of Stay & Readmission Rates - by Clinical Group table, several length of stay metrics are broken out by MS-DRGs, Readmission Groups, or BPCI.
- On the Skilled Nursing Analyze page, under the Operational tab, in the SNF's Summary table, the Average Medicare Days per Stay metric is included, and there is also a Median Medicare Days per Stay metric
- On the Skilled Nursing Analyze page, under the PDPM tab, Average Medicare Days per Stay metrics are broken out by Clinical Categories