Overview
The Patient Population section of the Hospitals and Agencies Analyze Page contains patient demographics that make you the expert on your selected facility's patients. These metrics are found under the Patient Population tab.
The Patient Demographics tab includes the following:
- Patient Volume - Historical counts of patients by three different criteria.
- Inpatient CMS Payer Mix - Distinct Patients - inpatient patient counts for Medicare FFS, Medicare Advantage, and Medicaid discharged from the selected facility
- Outpatient CMS Payer Mix - Distinct Patients - outpatient patient counts for Medicare FFS, Medicare Advantage, and Medicaid discharged from the selected facility
- Patient Locations - County - percentage of patient's county of residence.
- Diagnostic Breakout by Stay - counts of patient stays by Trella Health Diagnostic Group or MS-DRG for skilled nursing patients discharged from the selected facility.
- Chronic Conditions - Breakdown of patients by chronic condition diagnoses
- Patient Age Groups - Breakdown of patients by age.
![]() Each of these sets of data can be viewed as a table or as a chart.
Each of these sets of data can be viewed as a table or as a chart.
Understanding the Metrics
Patient Volume Table
The Patient Volume table provides metrics on the population of Medicare patients for the selected facility so you can gauge the facility's potential as a source of post-acute referrals.
![]() The top grey box labeled Inpatient is a drop-down button that will allow you to change the content of the table to patient counts for outpatient discharges.
The top grey box labeled Inpatient is a drop-down button that will allow you to change the content of the table to patient counts for outpatient discharges.
Total Distinct Patient Discharges
This number is the count of distinct Medicare patients treated by the facility during the quarter listed in the column header. Although the row header implies that these metrics are counts of discharges, these are counts of distinct patients.
![]() The column One Year Total is not a total, it is a count of distinct patients where the metric in each row is applied to the most recent one-year reporting period.
The column One Year Total is not a total, it is a count of distinct patients where the metric in each row is applied to the most recent one-year reporting period.
SNF Patients
This is the count of distinct patients discharged from the selected facility who were admitted to SNF care during the period listed in the column header. In order to create a logical proximity between the discharge and subsequent post-acute care, we only count patients in this row who were admitted to skilled nursing care within 30 days of discharge.
In-Facility Mortalities
This number is the count of patients who died while being treated at the selected facility.
Patient Locations
The Patient Locations table shows the percentage of patients treated by the selected facility within the one year reference period who resided in the listed county or ZIP code at the time their initial facility admission claim was filed. The one-year reference period aligns with the end of the last quarter for the data set included in Marketscape.
![]() The patient percentages in this table are calculated from all Medicare claims for the selected facility, not just SNF related claims.
The patient percentages in this table are calculated from all Medicare claims for the selected facility, not just SNF related claims.
Diagnostic Breakout by Stay
This table provides a percentage breakout by two different diagnosis models. For each diagnosis in either model, we provide a percentage of patient stays where the primary diagnosis on the claim aligns with the listed diagnostic category.
- Trella Health Diagnostic Grouping - This is Trella Health's unique diagnostic grouping model based on the ICD-10 Chapters. There are 20 different groups for all diagnoses, making this model very general.
- Diagnostic Related Group (DRG) - CMS uses this diagnostic grouping model as the model for billing under IPPS. There are more than 450 DRGs, so using this model allows you to identify the mix of diagnoses for your selected hospital in a high level of detail.
Trella Health Diagnostic Groupings
Use this diagnostic grouping model to identify broad areas of specialization as a connection between the selected facility and your agency.
![]() Any and all diagnostic categories where the percentage was calculated from a count of less than 11 patients will not be identified in the table but will be aggregated into the row titled, "Aggregated INS diagnostic categories."
Any and all diagnostic categories where the percentage was calculated from a count of less than 11 patients will not be identified in the table but will be aggregated into the row titled, "Aggregated INS diagnostic categories."
![]() For more information see, Trella Health Diagnostic Groupings.
For more information see, Trella Health Diagnostic Groupings.
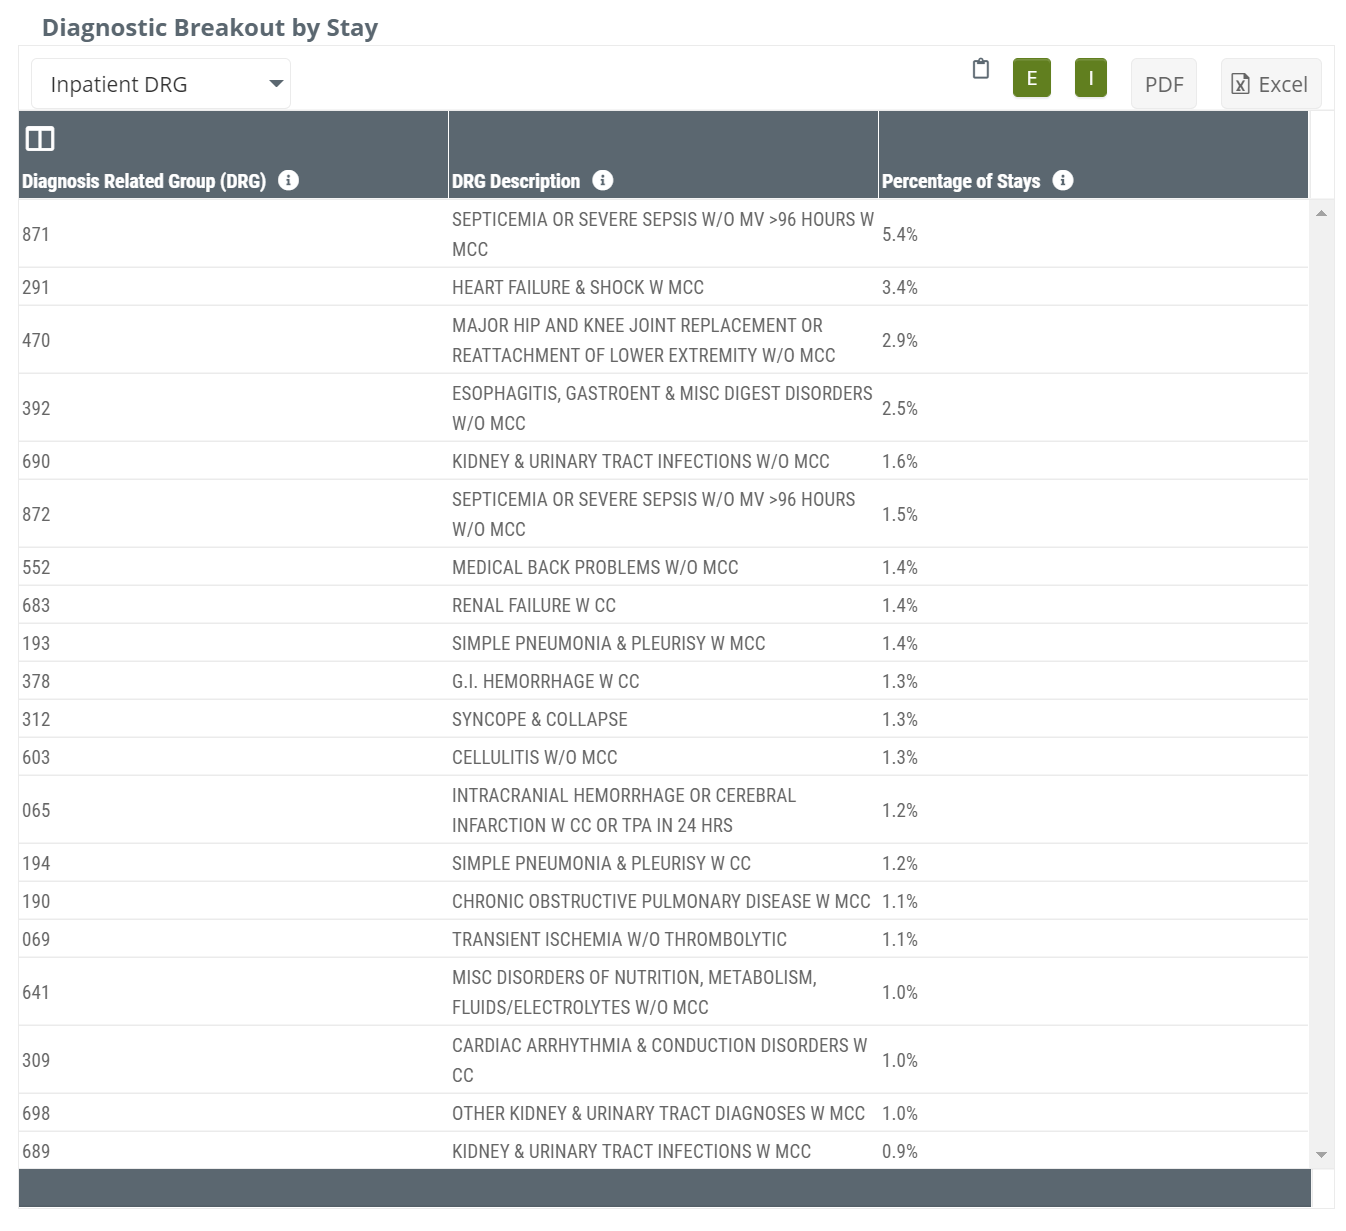
Inpatient DRG
As you can see from the image, using the Inpatient DRG diagnostic model provides a much more detailed view of the diagnoses for patients discharged from the selected hospital.
![]() Not all DRG's will be available in this table. We only include DRGs where the diagnosis represents >=11 distinct patients and more than 1% of the the total distinct patients.
Not all DRG's will be available in this table. We only include DRGs where the diagnosis represents >=11 distinct patients and more than 1% of the the total distinct patients.
 These diagnoses percentages only apply to patients discharged from inpatient care at the selected hospital.
![]() CC is Complication or Comorbidity, MCC is Major Complication or Comorbidity.
CC is Complication or Comorbidity, MCC is Major Complication or Comorbidity.
Patient Age
This table gives a simple breakout of the patients for the selected facility by age.


