Overview
The Hospitals and Agencies Explore page has one table that you can browse, filter, and search to identify and compare specific hospitals and agencies in your available markets. This article provides summaries of the metrics found in the table for the Hospitals &Agencies Explore page in Trella Insights for Skilled Nursing.
![]() For an overview of the features and tools on the Explore page, see The Explore page.
For an overview of the features and tools on the Explore page, see The Explore page.
Understanding the Metrics
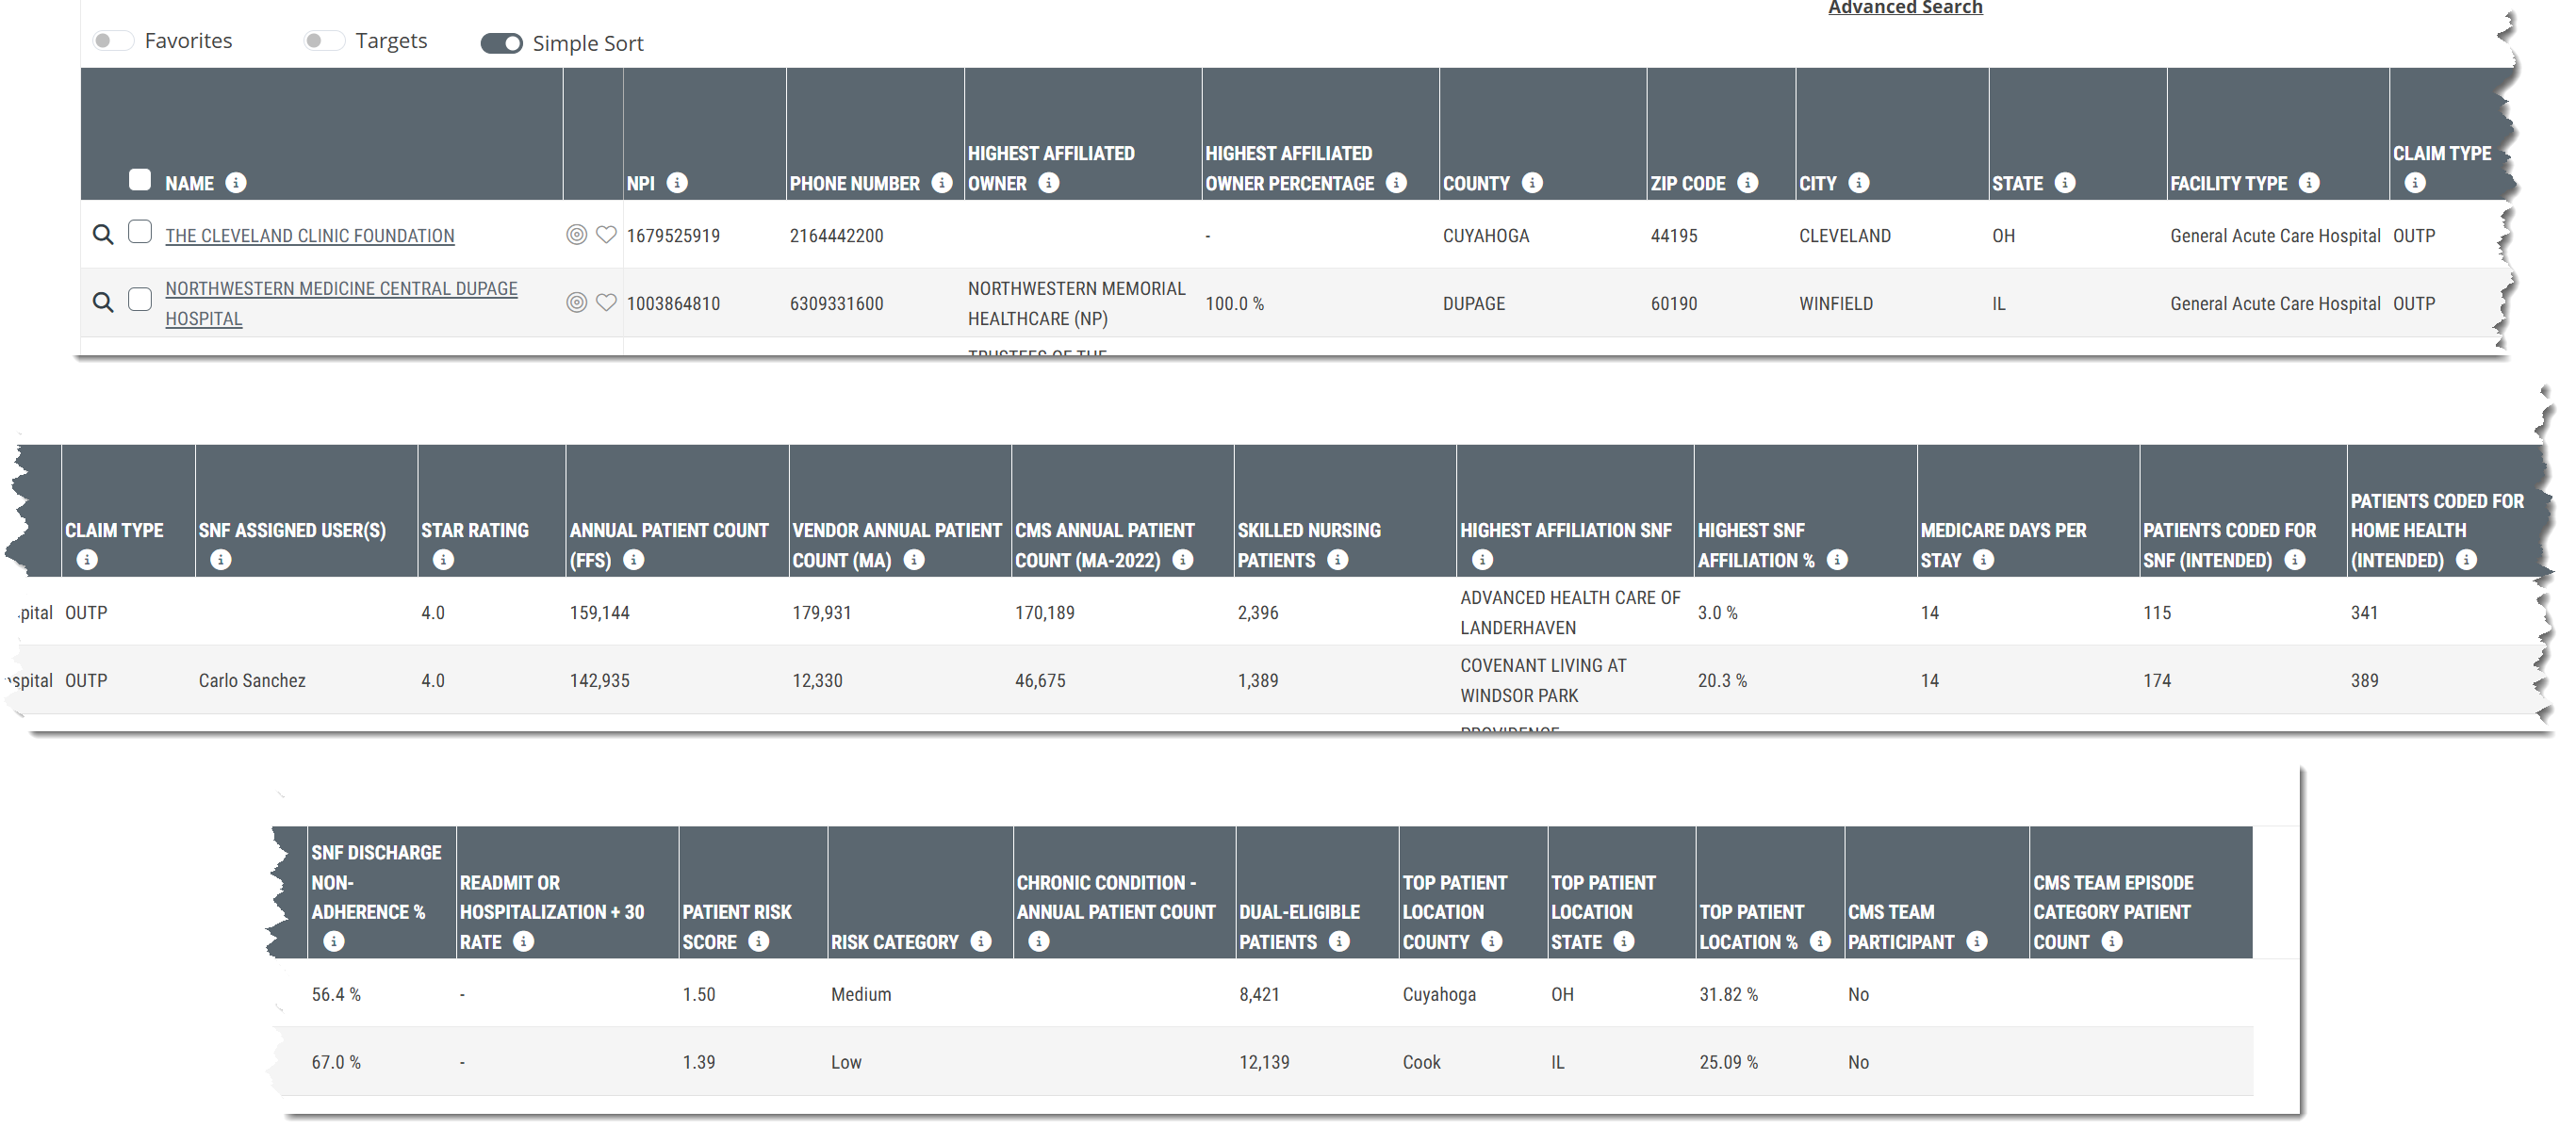
Explore page tables contain a lot of detailed metrics. The following image shows the header from the table for the Hospitals & Agencies Explore page in Trella Insights for Skilled Nursing. The image is broken into parts for easier visibility. The metrics in each column are described in the table below the image.
| Metric | Description |
|
Name, NPI (Two Columns) |
Facility name and NPI, as listed in the CMS Provider (NPI) file. An alias can be added to this name that is searchable throughout Trella Insights. |
|
Street Address, County, ZIP Code, City, State, Phone Number (Multiple columns) |
These columns show the street address, county, ZIP code, city, state, and phone number of the facility, as listed in the CMS Provider NPI file. |
| Facility Type |
The facility type identifies the taxonomy code listed for this NPI in the CMS Provider NPI file.
|
| Claim Type |
The Claim type is determined by the setting from which the claim was submitted (INP, OUTP, SNF, HHA, and HOS). You can see the possible claim types by clicking on the Claim Type filter.
|
| SNF Assigned User(s) | This column will contain the names of the user(s) from your company who is/are assigned to the listed hospital or agency. |
| Star Rating |
CMS created the five-star quality rating system to measure the experiences Medicare beneficiaries have with their health plan and health care system on a scale of 1 to 5 stars, with 5 being the highest quality.
|
| Vendor Annual Patient Count (MA) |
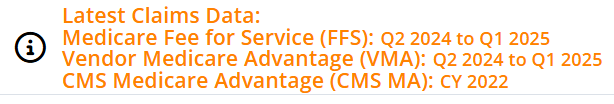
The count of distinct Medicare Advantage patients discharged from this facility during the one-year reporting period (ending in 20XX-QY) The actual year of the Vendor MA data is listed at the top right of the Explore page. These dates will change periodically with new data releases. (See sample image, below.)
|
| CMS Annual Patient Count (MA-20XX) |
This metric is the count of distinct Medicare Advantage patients who were admitted to the facility during the most recent year available from CMS (20XX) The actual year of the MA data is listed at the top right of the Explore page. These dates will change periodically with new data releases. (See sample image, below.)
|
| Annual Patient Count (FFS) | This is the count of distinct Medicare patients treated by the hospital or agency in each row during the one-year reporting period. |
| Skilled Nursing Patients |
The count of distinct Medicare FFS Patients treated at the listed hospital or agency during the one-year reporting period who received skilled nursing services within 30 days of discharge.
|
| Highest Affiliated Owner |
This column contains the highest affiliated direct owner of the listed hospital/agency. JV indicates Joint Venture. NP indicates Not for Profit. Additional owner details can be found on the Analyze page under the Ownership tab. |
| Highest Affiliated Owner Percentage |
This metric is the percentage of ownership accorded to the highest affiliated direct owner of the listed hospital/agency. Additional owner details can be found on the Analyze page under the Ownership tab. |
| Highest Affiliation SNF | The names shown in this column are the skilled nursing facilities with the highest percentage of the listed hospital's or agency's skilled nursing patients during the one-year reporting period. |
| Highest SNF Affiliation % | This metric is the percentage of the listed hospital's or agency's skilled nursing patients who were admitted to the hospital's or agency's highest affiliated skilled nursing facilty during the one-year reporting period. |
| All Patients Entering SNF w/in 30 days of D/C | This metric is the count of distinct Medicare patients treated at the listed hospital or agency that received SNF care within 30 days of discharge. |
| Medicare Days per Stay | This is the average count of Medicare days per stay the listed hospital's or agency's patients received SNF services. The counts for this metric only include SNF patients discharged during the most recent four quarters. |
| Patients Coded for SNF (Intended) |
This number is the count of patients discharged from the hospital or agency in each row with a status code in the discharge claim that indicates a need for SNF.
|
| Patients coded for Home Health (Intended) |
This metric is the count of patients discharged from care at the listed hospital or agency with a discharge code for home health care.
|
| SNF Discharge Non-Adherence % |
This is the percentage of patients discharged from care at the listed facility with a discharge code for SNF care who did not go into SNF care within 30 days of discharge from this facility.
|
| Readmit OR Hospitalization +30 Rate |
This column can include one of two different metrics, depending on the criteria below (in italics): Readmit Rate - If the facility is hospital inpatient - The metric will be the percent of distinct patients re-admitted to any inpatient facility within 30 days of discharge from the hospital listed in the row during the one year reporting period. Hospitalization Rate: + 30 - If the facility is any type other than a hospital - The metric will be the percentage of patients admitted to the facility listed in the row who were admitted to an inpatient setting during their stay or within 30 days of Discharge.
|
| Patient Risk Score and Risk Category |
These two metrics reflect the Average Hierarchical Condition Category (HCC) Risk Score for the given NPI and a categorization of this NPI's Risk Score in comparison to all NPI's of this type.
|
| Chronic Condition - Annual Patient Count |
If you use the Chronic Condition filter to select a chronic condition, this column will show the count of distinct patients treated during the one-year reporting period who met the criteria for the selected chronic condition based on the CCW Chronic Condition algorithm. If the filter is not used, this column will be blank. |
| Dual-Eligible Patients | The count of distinct Medicare FFS patients who were discharged from the listed hospital or agency and were also eligible for Medicaid coverage during the one-year reporting period, |
| Top Patient Location County | Top county of residence for Medicare FFS patients who were treated during the one-year reporting period at the listed hospital or agency; based on the beneficiary's county filed on the claim. |
| Top Patient Location State | Top state of residence for Medicare FFS patients who were treated during the one-year reporting period at the listed hospital or agency; based on the beneficiary's county filed on the claim. |
| Top Patient Location % | The percentage of Medicare FFS patients treated during the one-year reporting period who resided in the top patient state and county |
| CMS TEAM Participant | Identifies hospitals or agencies in the table that are participants in the Transforming Episode Accountability Model (TEAM), program. |
| CMS TEAM Episode Category Patient Count |
If you use the TEAM Episode Category filter to select a TEAM Episode Category, this column will show the count of distinct patients discharged from the listed hospital or agency with an inpatient MS-DRG associated with the selected TEAM Episode Category during the two-year reporting period. If the filter is not used, this column will be blank. |