Overview
The Trella Inferred Parent Network (TIPN) Analyze page includes six tables of metrics related to the TIPN that you selected on the Market Share report page.
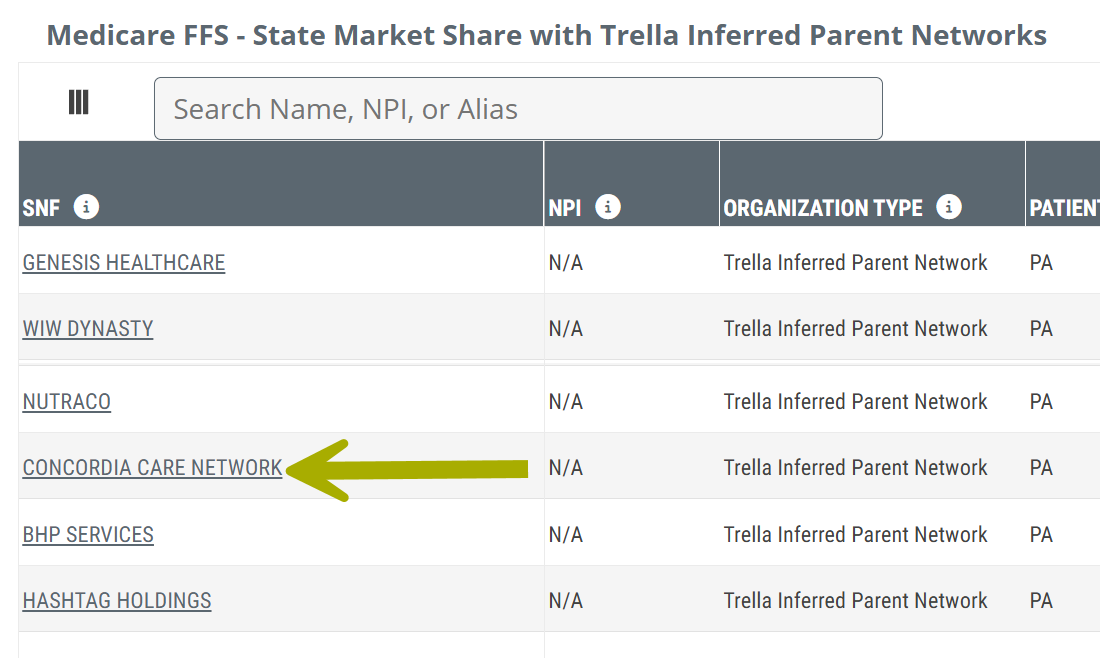
You can open a TIPN Analyze page on the Reports page under the Market Share tab in the Medicare FFS - State Market Share with Trella Inferred Parent Networks table.
![]() To open the TIPN Analyze page for a specific parent network, click on the name of the TIPN listed in the table.
To open the TIPN Analyze page for a specific parent network, click on the name of the TIPN listed in the table.
 Let's get Oriented
There are six tables of metrics under three tabs. The tables under each tab are listed below, with links to the detailed content for each table.
Tabs
There are four tabs on the TIPN Analyze page.
![]() The Insights tab is the default landing page when you first navigate to the TIPN Analyze page.
The Insights tab is the default landing page when you first navigate to the TIPN Analyze page.

Insights tab
There is one table under the Insights tab:
- Overall Skilled Nursing Medicare FFS Market Share - Coming Soon! Sample below
Network Details tab
There are four tables included on the TIPN Analyze page under the Networks tab:
![]() Some parent networks do not include organizations for all four of the possible entity types shown above. In those cases, the corresponding table will be empty - the alert "No records available" will appear in the table.
Some parent networks do not include organizations for all four of the possible entity types shown above. In those cases, the corresponding table will be empty - the alert "No records available" will appear in the table.
Destinations tab
There are three tables under the Destinations tab:
- FFS Skilled Nursing Destinations - <<Source Type>>
- FFS Home Health Destinations - <<Source Type>>
- FFS Hospice Destinations - <<Source Type>>
Sources tab
Header
The top of the TIPN Analyze page displays some basic information about the selected parent network.

![]() The image above shows the current tabs available for the TIPN Analyze page.
The image above shows the current tabs available for the TIPN Analyze page.
 In this article
- Insights tab
- Overall Skilled Nursing Medicare FFS Market Share - Coming Soon! Sample below
- Network Details tab
- Destinations tab
- Sources tab
Insights tab
Overall Skilled Nursing Medicare FFS Market Share table
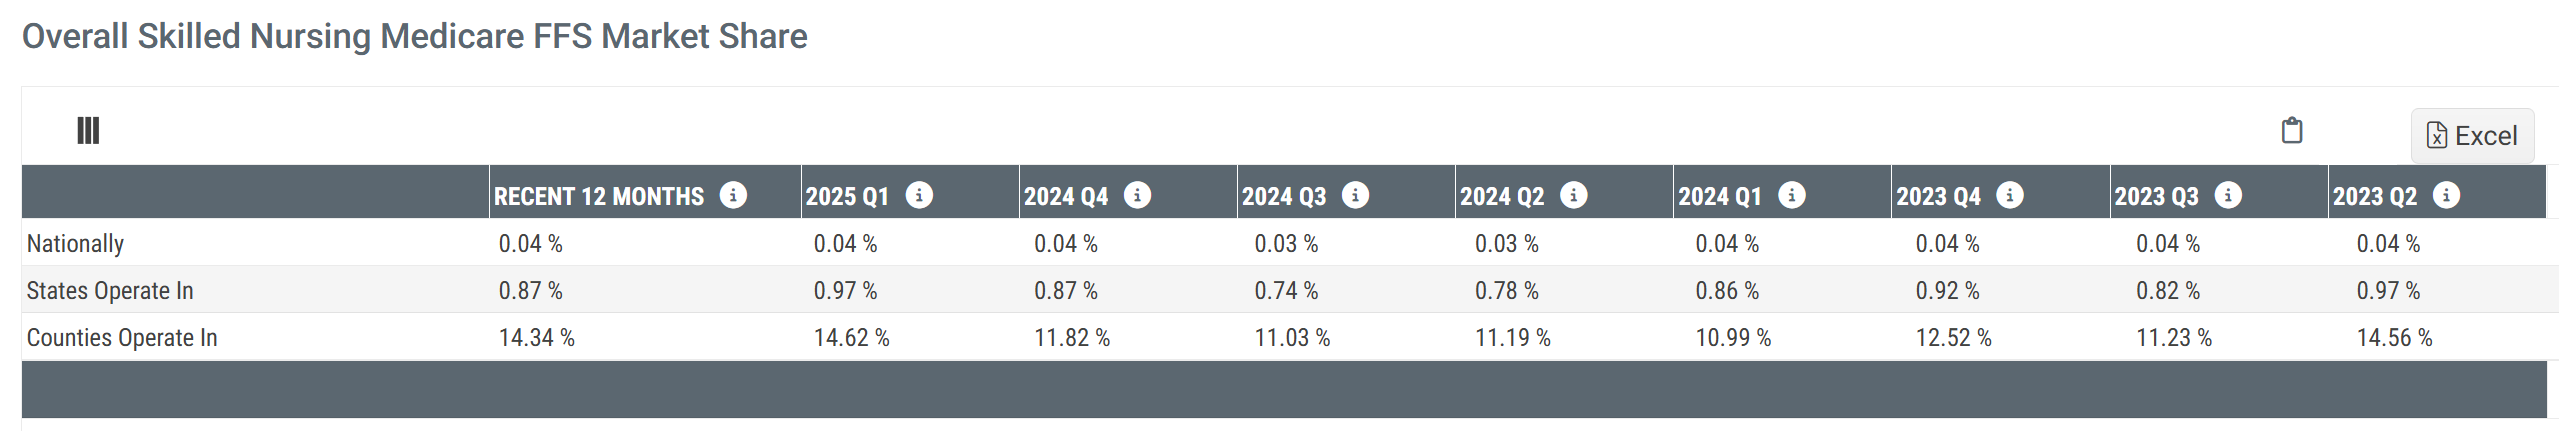
The Insights tab includes one table. The sample content below is a mockup of the upcoming table. It is possible that changes could occur as we further develop the content under the Insights tab.
![]() The Overall Skilled Nursing Medicare FFS Market Share table shows the selected TIPN's overall presence in the national, state, and county level markets. The metrics allow you to get the truest sense of the networks penetration at three regional levels.
The Overall Skilled Nursing Medicare FFS Market Share table shows the selected TIPN's overall presence in the national, state, and county level markets. The metrics allow you to get the truest sense of the networks penetration at three regional levels.
![]() The three rows in the table contain national, state, and county metrics.
The three rows in the table contain national, state, and county metrics.
Metric Name |
Description |
| <<First Column>> | Identifies that the metrics in the same row represent the market share nationally, for states operated in and counties operated in. |
| Recent 12 Months |
The percentage of Medicare FFS patients for the region listed in the row who were admitted to facilities aligned with the selected TIPN during the most recent 12 months of available data. |
| 20YY QX | The percentage of Medicare FFS patients for the region listed in the row who were admitted to facilities aligned with the selected TIPN during the period listed in the header. |
Network Details tab
- Click on the Network Details tab to see the tables included under the tab.

There are four tables under the Network Details tab. Details for each table are included below.
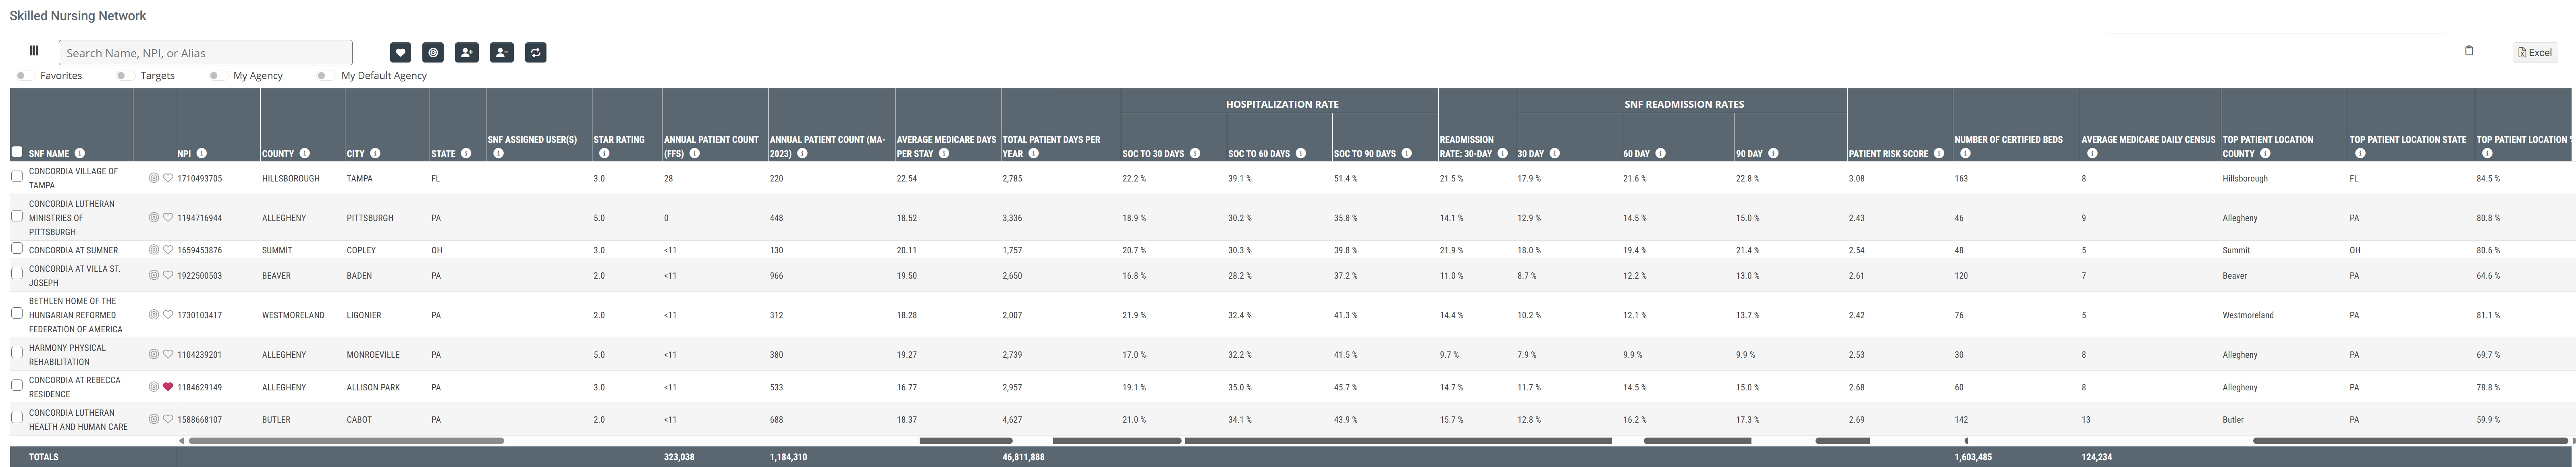
Skilled Nursing Network
The Skilled Nursing Network table displays all hospices aligned with the selected TIPN.
![]() This table allows you to evaluate and compare critical metrics for the skilled nursing facilities aligned with the selected TIPN.
This table allows you to evaluate and compare critical metrics for the skilled nursing facilities aligned with the selected TIPN.
Metric Name |
Description |
|
| SNF Name/NPI | The name and NPI of the skilled nursing facility for which the metrics in the same row are displayed. | |
|
Favorites/Targets
|
Click on these icons to make the listed organization a Favorite (heart icon) or a Target (target icon). | |
| County/City/State | The county, city, and state for the listed skilled nursing facility, taken from the NPPES registry for the agency. | |
| SNF Assigned User(s) |
User assigned to this NPI |
|
| Star Rating | CMS five-star quality rating system to measure the experiences Medicare beneficiaries have with their health plan and health care system on a scale of 1 to 5 stars, with 5 being the highest quality | |
| Annual Patient Count (FFS) | The count of distinct Medicare FFS patients admitted to the listed skilled nursing facility during the one-year reporting period. | |
| Annual Patient Count (MA-20YY) |
The count of distinct Medicare Advantage patients admitted to the skilled nursing facility listed in the row during the most recent year of data available from CMS. The latest year of data available for Medicare Advantage metrics is shown at the top right of every page in Trella Insights. (see image)
|
|
| Average Medicare Days per Stay | Average number of Medicare FFS-covered days spent in the listed skilled nursing facility for patients that completed stays during the one-year reporting period. | |
| Total Patient Days per Year | The sum of Medicare FFS-covered patient days spent in the listed skilled nursing facility during the one-year reporting period. | |
| Hospitalization Rate | SOC to 30 Days |
The percentage of patients admitted to the listed skilled nursing facility during the two year reporting period who were admitted to a hospital within 30 days of start of care at the listed facility. |
| SOC to 60 Days | The percentage of patients admitted to the listed skilled nursing facility during the two year reporting period who were admitted to a hospital within 60 days of start of care at the listed facility. | |
| SOC to 90 Days | The percentage of patients admitted to the listed skilled nursing facility during the two year reporting period who were admitted to a hospital within 90 days of start of care at the listed facility. | |
| Readmission rate: 30-Day | The percentage of patients discharged from inpatient care and admitted to the listed SNF who were subsequently readmitted to any hospital within 30 days of the initial discharge. This metric is based on two years of discharges, shifted back 30 days to allow for readmissions. | |
| SNF Readmission rates | 30 Day | The percentage of patients discharged from Inpatient care and admitted to the listed SNF who were subsequently readmitted to any hospital within 30 days of the initial discharge. This metric is based on two years of discharges, shifted back 90 days so that the 30 day, 60 day, and 90 day metrics shown can be faithfully compared since they represent the same patient population. |
| 60 Day | The percentage of patients discharged from Inpatient care and admitted to the listed SNF who were subsequently readmitted to any hospital within 60 days of the initial discharge. This metric is based on two years of discharges, shifted back 90 days so that the 30 day, 60 day, and 90 day metrics shown can be faithfully compared since they represent the same patient population. | |
| 90 Day | The percentage of patients discharged from Inpatient care and admitted to the listed SNF who were subsequently readmitted to any hospital within 90 days of the initial discharge. This metric is based on two years of discharges, shifted back 90 days so that the 30 day, 60 day, and 90 day metrics shown can be faithfully compared since they represent the same patient population. | |
| Patient Risk Score | Average Hierarchical Condition Category (HCC) Medicare FFS Patient Risk Score for the hospice listed in the row. | |
| Number of certified beds | Count of certified beds for this SNF, based on the most recent number reported by CMS | |
| Average Medicare Daily Census | Represents the average number of Medicare FFS patients the listed skilled nursing facility serves daily; calculated as the sum of patient days admitted during the one-year reporting period, divided by 365. | |
| Top Patient Location County | Top county of residence for Medicare FFS patients who were treated by the listed skilled nursing facility during the one-year reporting period; based on the beneficiary's county filed on the claim. | |
| Top Patient Location State | Top state of residence for Medicare FFS patients who were treated by the listed skilled nursing facility during the one-year reporting period; based on the beneficiary's state filed on the claim. | |
| Top Patient Location % | The percentage of Medicare FFS patients who reside in the listed county and state, who were admitted to the listed skilled nursing facility during the one year reporting period. | |

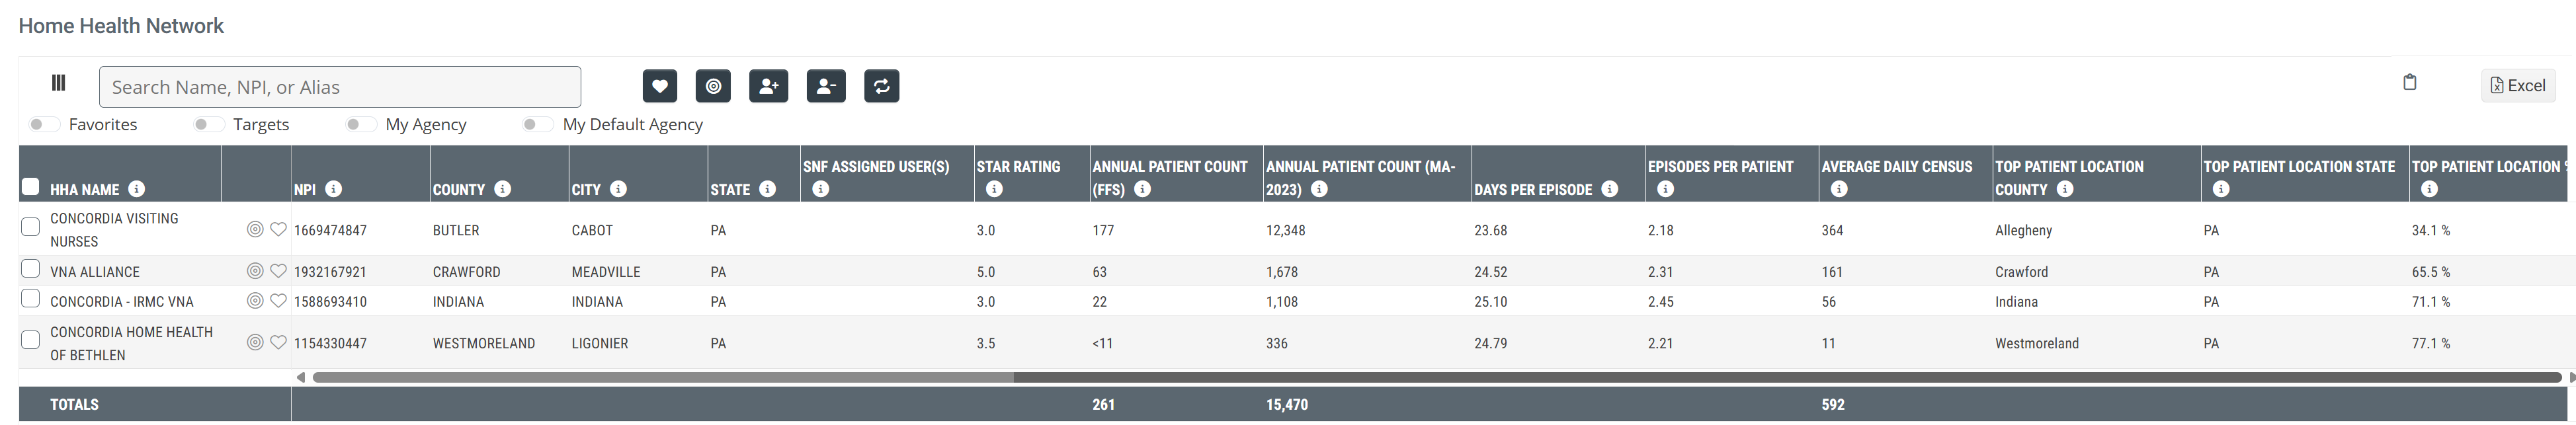
Home Health Network
The Home Health Network table displays all home health agencies aligned with the selected TIPN.
![]() This table allows you to evaluate and compare critical metrics for the home health agencies aligned with the selected TIPN.
This table allows you to evaluate and compare critical metrics for the home health agencies aligned with the selected TIPN.
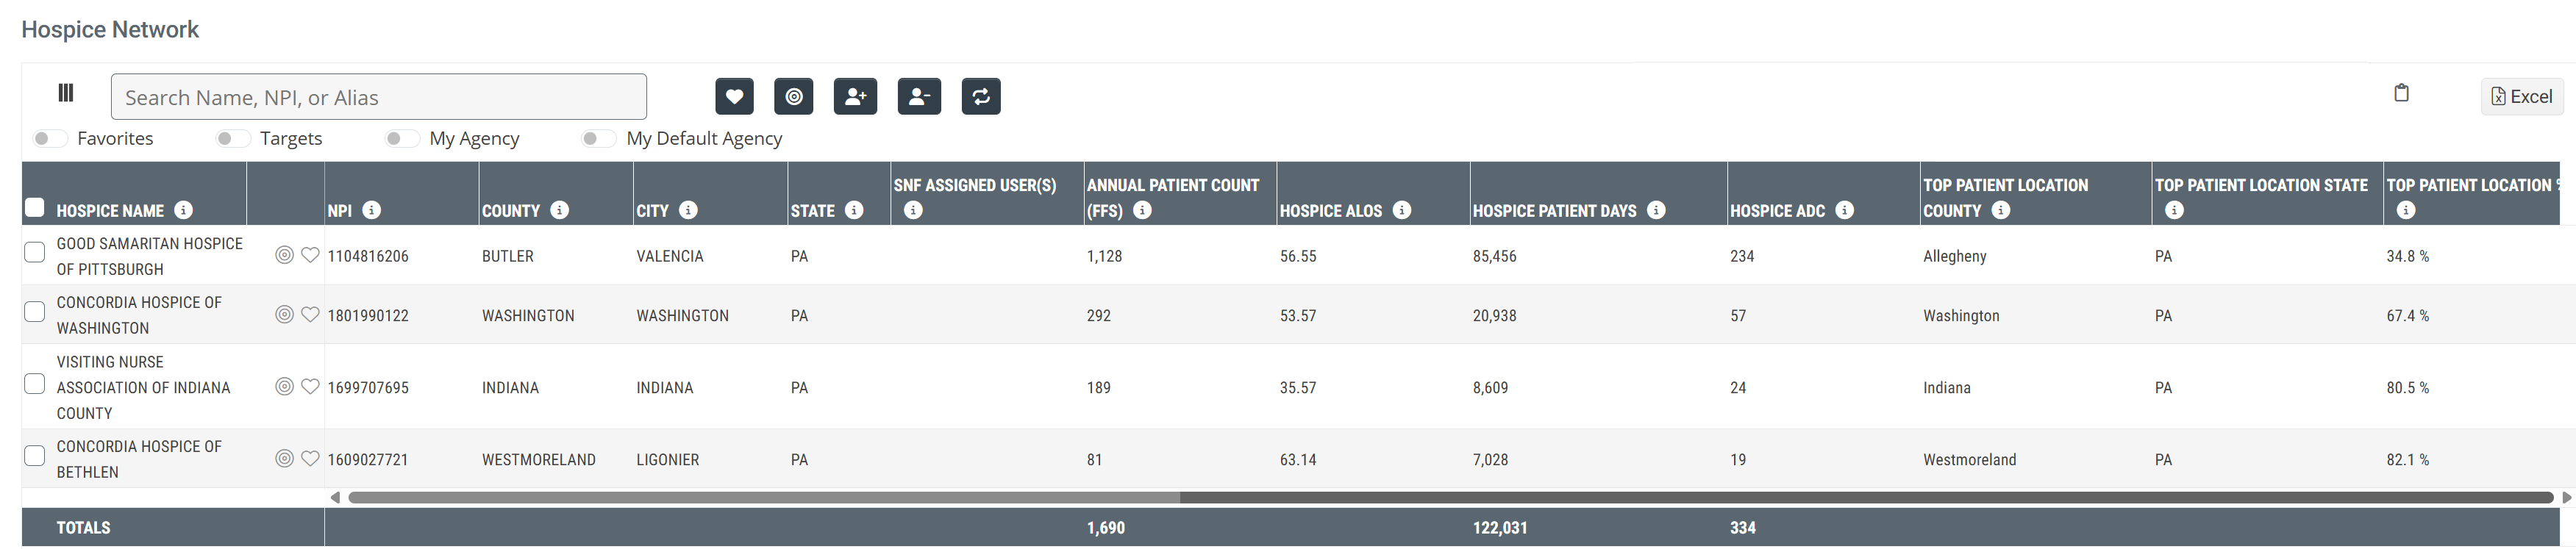
Hospice Network
The Hospice Network table displays all hospices aligned with the selected TIPN.
![]() This table allows you to evaluate and compare critical metrics for the hospices aligned with the selected TIPN.
This table allows you to evaluate and compare critical metrics for the hospices aligned with the selected TIPN.
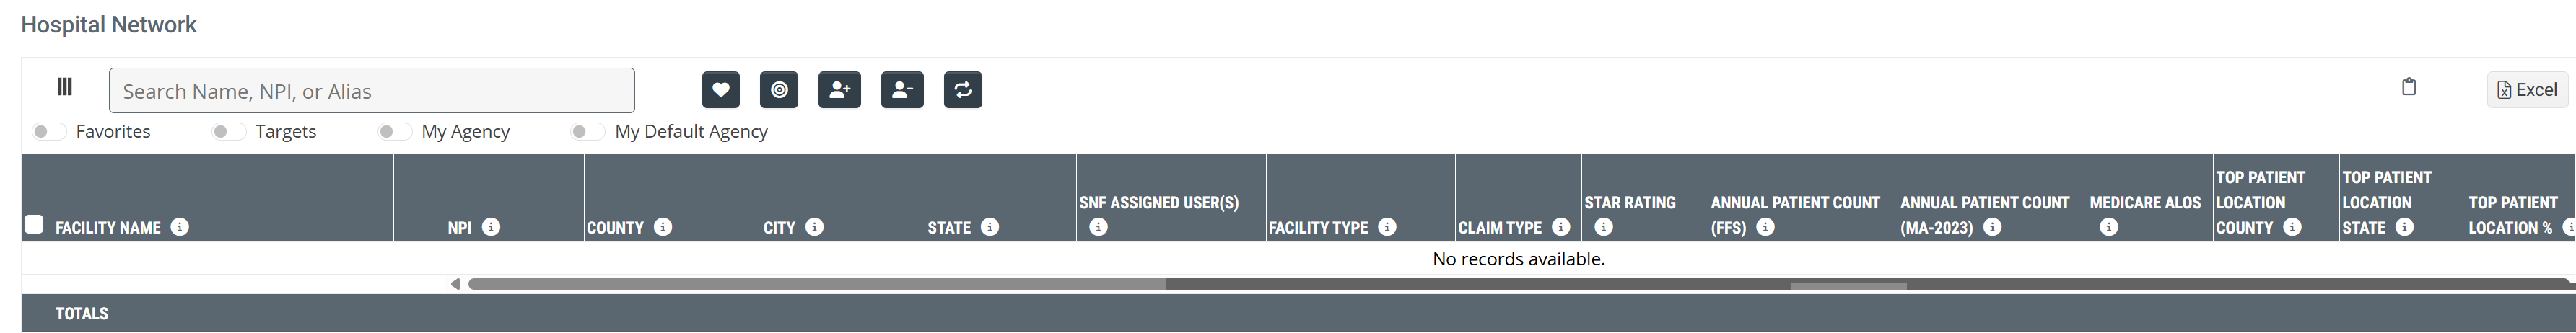
Hospital Network
The Hospital Network table displays all hospitals aligned with the selected TIPN.
![]() This table allows you to evaluate and compare critical metrics for the hospitals aligned with the selected TIPN.
This table allows you to evaluate and compare critical metrics for the hospitals aligned with the selected TIPN.
![]() The image below shows no entries in the table. Not every Trella Inferred Parent Network includes an organization of each type for which there is a table. Nevertheless, the image shows the table headers that would appear in a table that did have entries.
The image below shows no entries in the table. Not every Trella Inferred Parent Network includes an organization of each type for which there is a table. Nevertheless, the image shows the table headers that would appear in a table that did have entries.
Destinations tab
Overview
There are three tables under the Destinations tab. There is a table for skilled nursing facilities, a table for home health agencies, and a table for hospices. Each post-acute care entity listed in these tables admitted patients for care who were discharged from specific organization types aligned with the selected Trella Inferred Parent Network.
 Parallel reference
For those of you who are familiar with Destinations tables under other Analyze pages in Trella Insights, this tab is similar and different. It is similar in that these tables display metrics that trace populations of patients through the continuum of care that are admitted to the organizations listed in the tables. The difference is that elsewhere in Trella Insights, the patients are traced from individual providers, and under this tab, the patients include those discharged/treated by multiple organizations aligned with the selected TIPN. This provides a macro view of the care continuum. You will select a single organization type as the source for patients admitted to the entries in the destinations tables.
Filters, Titles, Sources, Destinations, and Metric Definitions
Filter By
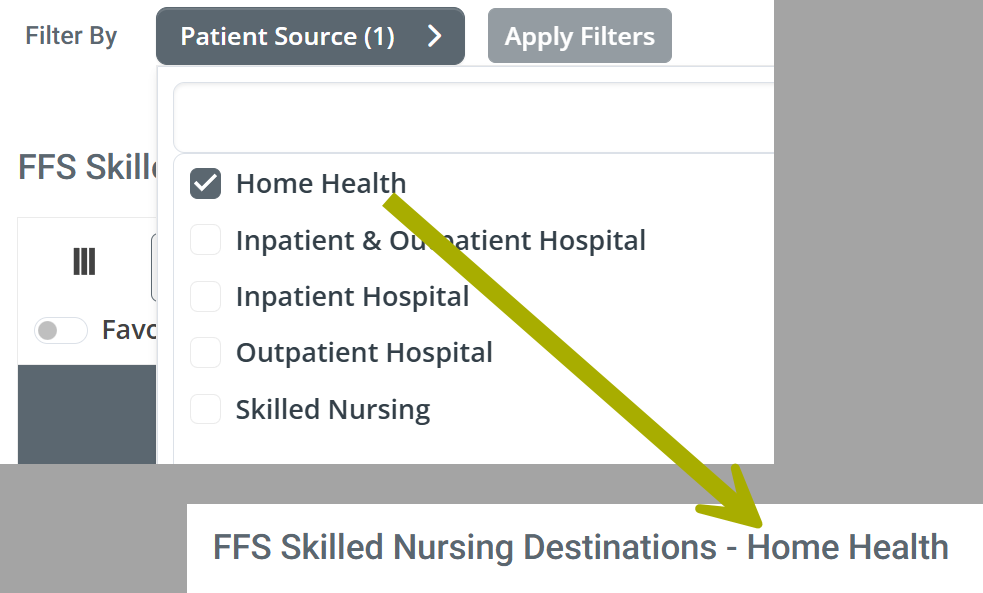
At the top of the Destinations tab Analyze page, above the first table, there is a "Filter By" Patient Source dropdown that allows you to choose the source type (organization) that you want to use for the tables under the Destinations tab. All metrics in the tables under the Destinations tab will reflect patients discharged from the care setting you choose in the dropdown.
The following image shows the options available in the filter dropdown.
 Details
- Some TIPN Analyze Destinations pages will not include all of the options shown above
- It is possible that you can select a source that will not produce any results in one or more of the tables on the page
- Even though the filter uses checkboxes instead of radio buttons, you can only choose one filter option at a time
![]() This feature allows you to trace patient flows through the continuum of care with greater specificity by choosing a single care setting as the patient source.
This feature allows you to trace patient flows through the continuum of care with greater specificity by choosing a single care setting as the patient source.
- Click on the option you want to use to populate the tables under the Destinations tab.
- Click on the "Apply Filters" button to activate your choice.

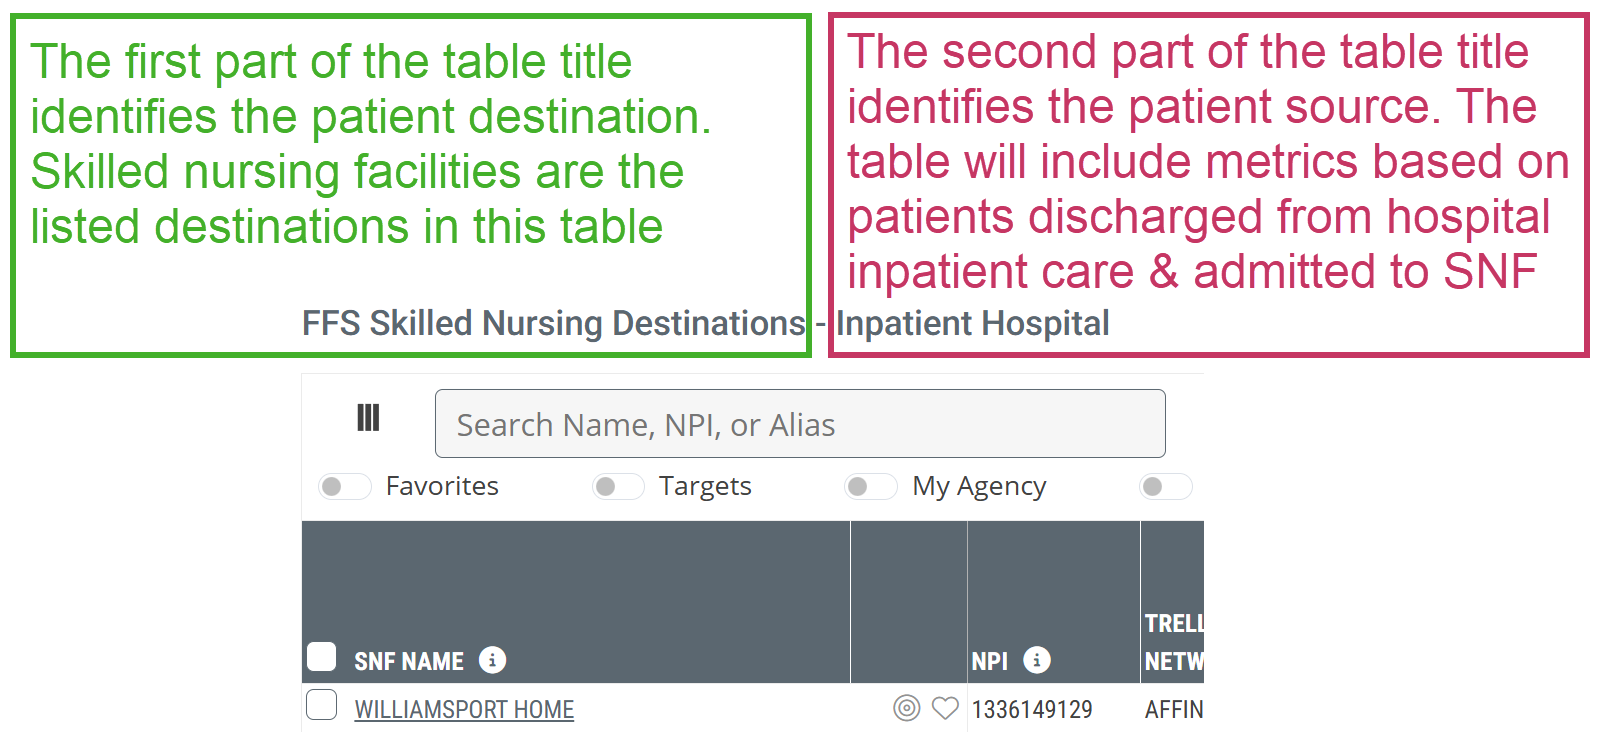
Table Titles
The image above displays the title of the the FFS Skilled Nursing Destinations table. (arrow) The table title will change to show, after the hyphen "-," the organization source type that is currently active on the page. Another example is shown below.
- Destinations: Skilled Nursing Facilities - identifies the organization listed in each row in the table.
- Sources: Hospitals, counts from inpatient claims admitted to skilled nursing care
Count Definitions
The tables show metrics for the specific destination and source organization types displayed in the table. The tables include many different annual and quarterly patient counts for patients discharged from the source type and admitted to the destination type.
The definitions that open when you click on the "i" button -  in the column header for counts in all tables are similar to what follows:
"Aggregated count of Medicare FFS patients who were discharged from any hospital/agency/facility in the TIPN and admitted to the listed <destination org> within 30 days after discharge during the (period listed in the header)"
In order to keep things simple, all count definitions follow the above pattern, the three elements listed in color above will change slightly. In order to keep things straight, follow these guidelines
- Blue Source - This is a reference to the organization source type listed in the table title. (This is also the source type you can select with the "Filter By" Patient Source dropdown filter.
- Red Destination - This is a reference to the organization destination type which is listed in the table title. Each entry named in a row of the table is a destination.
- Green Reporting Period - This will always be the reporting period listed in the column header.
 Why all this definition detail?
Trella Health uses specific terms to refer to specific organization types, but sometimes these terms are used differently for different lines of business. One example: in Trella Insights for Hospice, the term "facility" is used for source organizations for patients entering care at a hospice. In the hospice line of business, a "facility" source could be a hospital, inpatient or outpatient, or a home health agency, or a skilled nursing facility. However! In Trella Insights for Skilled Nursing, the word "facility" is used only as a reference to a skilled nursing facility. In the SNF line of business, patients sources are specified; hospital, or home health agency.
On the TIPN Analyze page, we are looking at Trella Inferred Parent Networks! Yes! These networks include hospitals, home health agencies, hospices, and skilled nursing facilities. In order to make a single, more general, definition for use in the destinations tables, we use generic terms in the definitions, and sometimes they do not comply with the "official" definition used elsewhere in the same Trella Insights module.
But... if you remember to match the source and destination types (as suggested here) to the table title, the definitions will make sense.
![]() Sorry, one more thing. Since any table you are viewing might be different from the examples included below, we include a more general definition that aligns with the destinations, which are fixed, but the sources are identified as "from any organization associated with the selected TIPN of the type listed as the source in the table title."
Sorry, one more thing. Since any table you are viewing might be different from the examples included below, we include a more general definition that aligns with the destinations, which are fixed, but the sources are identified as "from any organization associated with the selected TIPN of the type listed as the source in the table title."
FFS Skilled Nursing Destinations - <<Source Type>>
The FFS Skilled Nursing Destinations table will show metrics related to the skilled nursing facilities listed in the table. Keep in mind that since the listed destinations are admitting patients from a network of organizations, not only will the numbers be higher than in destination tables for a single source organization, but also, the destinations could potentially slop over into a much larger region than in other destination tables, even into additional states.
![]() Source Type - Remember - The organization source type for metrics in this table will depend on the choice you made using the Filter By Patient Source dropdown at the top of the page.
Source Type - Remember - The organization source type for metrics in this table will depend on the choice you made using the Filter By Patient Source dropdown at the top of the page.
![]() Although the following image shows the Destinations table for Inpatient and Outpatient Hospitals as a source, the metrics and definitions below will be similar for each source type you choose. The only exception is the count definitions as described above.
Although the following image shows the Destinations table for Inpatient and Outpatient Hospitals as a source, the metrics and definitions below will be similar for each source type you choose. The only exception is the count definitions as described above.


Understanding the Metrics
Metric name |
Description |
|
| SNF Name/NPI | The name and NPI of the skilled nursing facility for which the metrics in the same row are displayed. | |
|
Favorites/Targets
|
Click on these icons to make the listed organization a Favorite (heart icon) or a Target (target icon). | |
| Address/County/City/State | The address, county, city, and state for the listed skilled nursing facility, taken from the NPPES registry for the agency. | |
| Trella Inferred Parent Network (TIPN) | ||
| SNF Assigned User(s) | The names of the user or users in your company assigned to the listed skilled nursing facility in the skilled nursing line of business | |
| SNF Patients | The count of distinct Medicare FFS patients who were discharged from any organization associated with the selected TIPN of the type listed as the source in the table title and who were admitted to the listed skilled nursing facility within 30 days after discharge during the one-year reporting period. | |
|
Patient Counts 8 quarters |
20YY QX | The count of distinct Medicare FFS patients who were discharged from any organization associated with the selected TIPN of the type listed as the source in the table title and who were admitted to the listed skilled nursing facility within 30 days after discharge during the reporting period listed in the header |
| SNF Readmission Rates | 30-Day | The percentage of patients discharged from Inpatient care and admitted to the listed SNF who were subsequently readmitted to any hospital within 30 days of the initial discharge. This metric is based on two years of discharges, shifted back 90 days so that the 30 day, 60 day, and 90 day metrics shown can be faithfully compared since they represent the same patient population. |
| 60-Day | The percentage of patients discharged from Inpatient care and admitted to the listed SNF who were subsequently readmitted to any hospital within 60 days of the initial discharge. This metric is based on two years of discharges, shifted back 90 days so that the 30 day, 60 day, and 90 day metrics shown can be faithfully compared since they represent the same patient population. | |
| 90-Day | The percentage of patients discharged from Inpatient care and admitted to the listed SNF who were subsequently readmitted to any hospital within 90 days of the initial discharge. This metric is based on two years of discharges, shifted back 90 days so that the 30 day, 60 day, and 90 day metrics shown can be faithfully compared since they represent the same patient population. | |
| SNF Patient Risk Score | Average Hierarchical Condition Category (HCC) patient risk score for the SNF's overall patient population | |
| SNF Risk Category |
Categorization of the SNF's overall patient risk score
|
|
![]() The Patient Count metric may include Medicare FFS patients counted more than once, if the attended multiple facilities within the TIPN.
The Patient Count metric may include Medicare FFS patients counted more than once, if the attended multiple facilities within the TIPN.
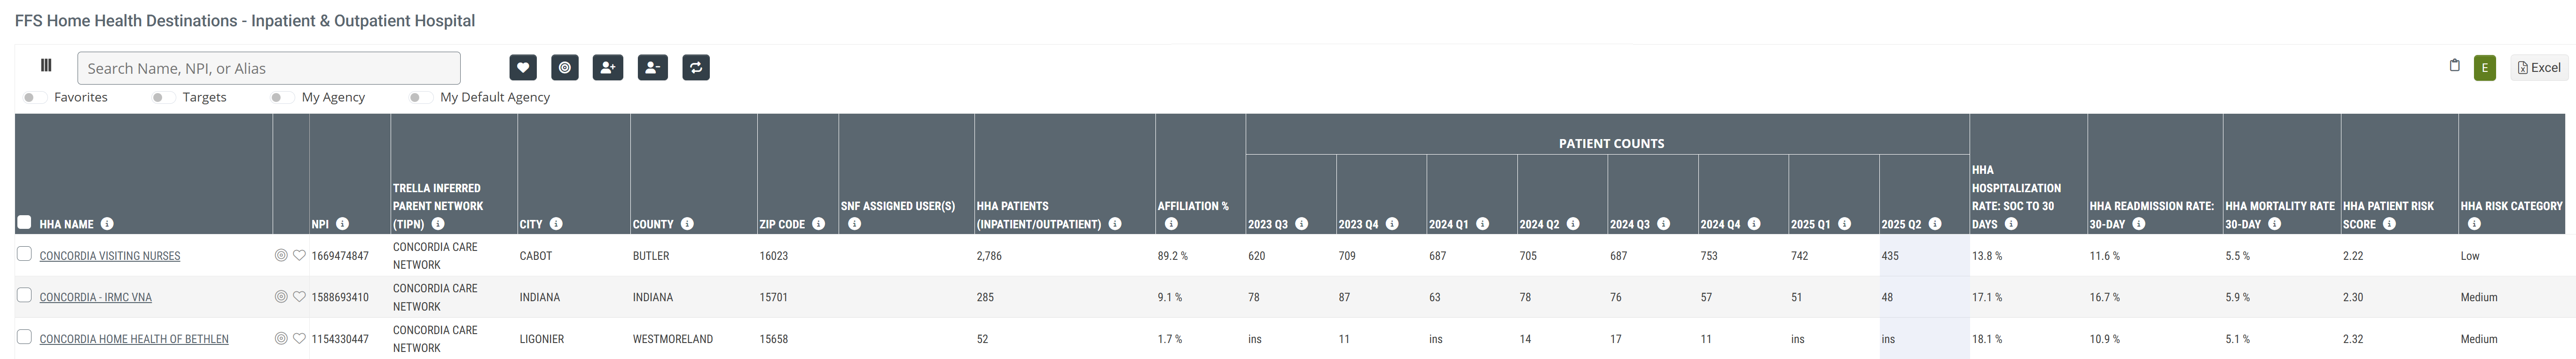
FFS Home Health Destinations - <<Source Type>>
The FFS Home Health Destinations table will show metrics related to the home health agencies listed in the table. Keep in mind that since the listed destinations are admitting patients from a network of organizations, not only will the numbers be higher than in destination tables for a single source organization, but also, the destinations could potentially slop over into a much larger region than in other destination tables, even into additional states.
![]() Source Type - Remember - The organization source type for metrics in this table will depend on the choice you made using the Filter By Patient Source dropdown at the top of the page.
Source Type - Remember - The organization source type for metrics in this table will depend on the choice you made using the Filter By Patient Source dropdown at the top of the page.
![]() Although the following image shows the Destinations table for Inpatient and Outpatient Hospitals as a source, the metrics and definitions below will be similar for each source type you choose. The only exception is the count definitions as described above.
Although the following image shows the Destinations table for Inpatient and Outpatient Hospitals as a source, the metrics and definitions below will be similar for each source type you choose. The only exception is the count definitions as described above.
Understanding the Metrics
Metric Name |
Description |
|
| HHA Name/NPI | The name and NPI of the home health agency for which the metrics in the same row apply. | |
|
Favorites/Targets
|
Click on these icons to make the listed organization a Favorite (heart icon) or a Target (target icon). | |
| Trella Inferred Parent Network (TIPN) | The name of the Trella Inferred Parent Network associated with the listed home health agency | |
| Address/City/State/County/ZIP Code | The location information for the listed home health agency | |
| SNF Assigned Users(s) | The names of the user or users in your company assigned to the listed home health agency in the skilled nursing line of business | |
| HHA Patients | The count of distinct Medicare FFS patients who were discharged from any organization associated with the selected TIPN of the type listed as the source in the table title and who were admitted to the listed home health agency within 30 days after discharge during the one-year reporting period. | |
|
Patient Counts Eight Quarters |
20YY QX |
The count of distinct Medicare FFS patients who were discharged from any organization associated with the selected TIPN of the type listed as the source in the table title and who were admitted to the listed home health agency within 30 days after discharge during the reporting period listed in the header. The column for the most recent quarter of data is highlighted as a reminder that counts might be smaller than expected.
|
| HHA Hospitalization Rate: SOC to 30 Days | The percentage of patients admitted to the listed home health agency who were hospitalized within 30 days from start of care at the home health agency; includes transfers. This metric is calculated for a two year reporting period. | |
| HHA Readmission Rate: 30-Day | The rate at which the listed HHA's Medicare FFS patients came from an inpatient setting, were newly admitted to the listed home health agency, and were subsequently readmitted to any hospital within 30 days of the first inpatient discharge; includes transfers (based on two years of discharges, shifted back 30 days to allow for the readmission). | |
| HHA Mortality Rate 30-Day | The percentage of patients discharged from the listed home health agency who died within 30 days after discharge (based on a two-year reporting period, shifted back 30 days) | |
| HHA Patient Risk Score | Average Hierarchical Condition Category (HCC) patient risk score for the listed home health agency's overall patient population | |
| HHA Risk Category |
Categorization of the listed home health agency's overall patient risk score
|
|
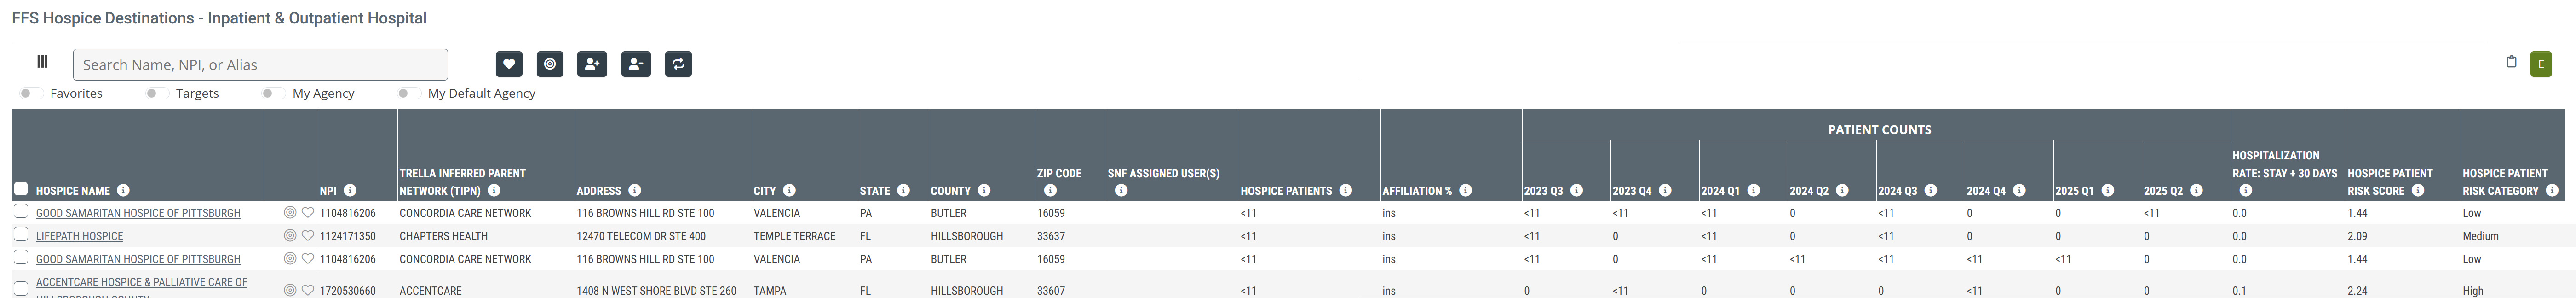
FFS Hospice Destinations - <<Source Type>>
The FFS Hospice Destinations table will show metrics related to the hospices listed in the table. Keep in mind that since the listed destinations are admitting patients from a network of organizations, not only will the numbers be higher than in destination tables for a single source organization, but also, the destinations could potentially slop over into a much larger region than in other destination tables, even into additional states.
![]() Source Type - Remember - The organization source type for metrics in this table will depend on the choice you made using the Filter By Patient Source dropdown at the top of the page.
Source Type - Remember - The organization source type for metrics in this table will depend on the choice you made using the Filter By Patient Source dropdown at the top of the page.
![]() Although the following image shows the Destinations table for Inpatient and Outpatient Hospitals as a source, the metrics and definitions below will be similar for each source type you choose. The only exception is the count definitions as described above.
Although the following image shows the Destinations table for Inpatient and Outpatient Hospitals as a source, the metrics and definitions below will be similar for each source type you choose. The only exception is the count definitions as described above.
Understanding the Metrics
Metric Name |
Description |
|
| Hospice Name/NPI | The name and NPI of the hospice for which the metrics in the same row apply. | |
|
Favorites/Targets
|
Click on these icons to make the listed organization a Favorite (heart icon) or a Target (target icon). | |
| Trella Inferred Parent Network (TIPN) | The name of the Trella Inferred Parent Network associated with the listed hospice | |
| Address/City/State/County/ZIP Code | The location information for the listed hospice | |
| SNF Assigned Users(s) | The names of the user or users in your company assigned to the listed hospice in the skilled nursing line of business | |
| Hospice Patients | The count of distinct Medicare FFS patients who were discharged from any organization associated with the selected TIPN of the type listed as the source in the table title and who were admitted to the listed hospice within 30 days after discharge during the one-year reporting period. | |
|
Patient Counts Eight Quarters |
20YY QX | The count of distinct Medicare FFS patients who were discharged from any organization associated with the selected TIPN of the type listed as the source in the table title and who were admitted to the listed hospice within 30 days after discharge during the reporting period listed in the header |
| Hospitalization Rate: +30 Days | The percentage of patients admitted to the listed hospice who were hospitalized during the hospice election period or within 30 days after discharge from hospice . This metric is calculated for a two year reporting period. | |
| Hospice Patient Risk Score | Average Hierarchical Condition Category (HCC) patient risk score for the listed hospice's overall patient population | |
| Hospice Risk Category |
Categorization of the listed hospice's overall patient risk score
|
|
Sources Tab
A central focus of Trella Insights is tracking patients through the continuum of care. The tables under the Sources tab contain lists of hospitals, agencies, and physician sources of patients to skilled nursing facilities in the selected TIPN.
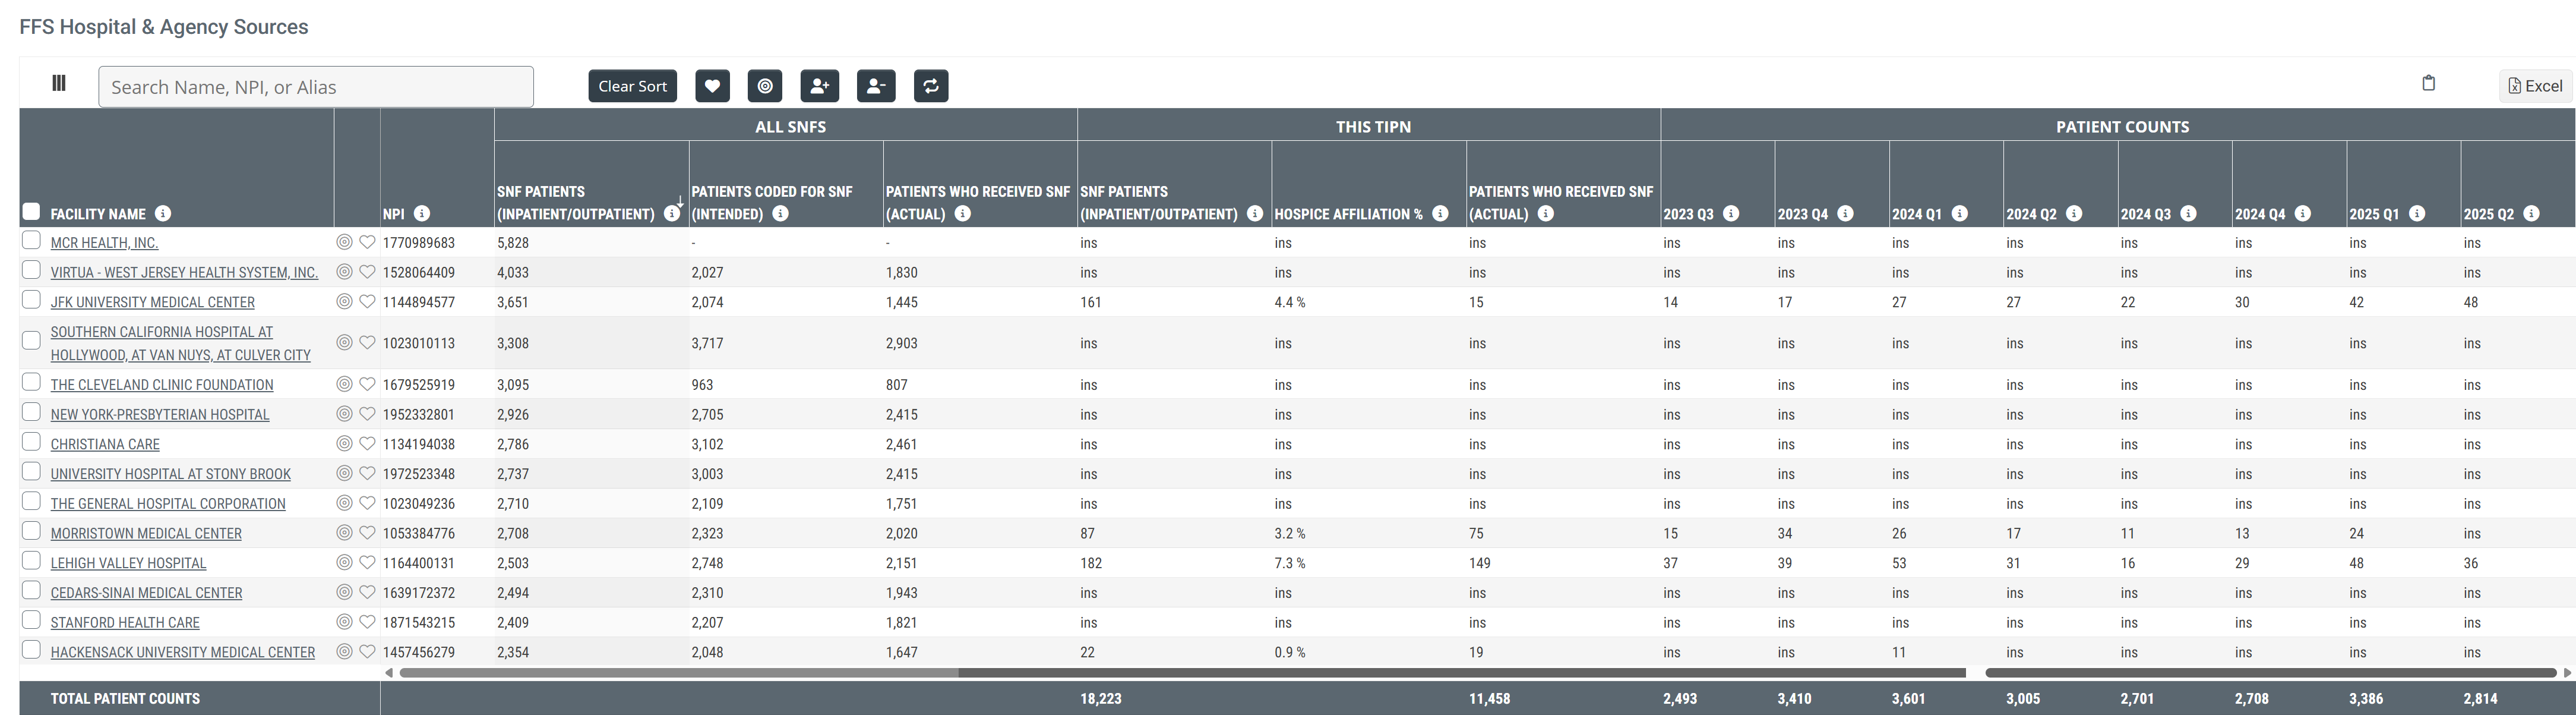
FFS Hospital and Agency Sources
The sources listed in this table are hospitals or agencies that discharged patients who were admitted to a skilled nursing facility in the selected TIPN. Some facilities listed are part of the same TIPN and other facilities are not.
Metric Name |
Description |
|
|
Facility Name/NPI
|
The name and NPI of the hospital or agency for which the metrics in the same row are displayed. Other skilled nursing facilities appear in this table.) | |
|
Favorites/Targets
|
Click on these icons to make the listed organization a Favorite (heart icon) or a Target (target icon). | |
| All SNFs | SNF Patients (Inpatient/Outpatient) | The count of distinct Medicare FFS patients discharged from the listed hospital or agency and admitted to any skilled nursing facility within 30 days after discharge and during the one-year reporting period |
| Patients Coded for SNF (Intended) | The count of distinct Medicare FFS patients discharged from the listed hospital or agency with a discharge status code indicating a need for skilled nursing care during the one-year reporting period | |
| Patients who received SNF (Actual) | The count of distinct Medicare FFS patients discharged from the listed hospital or agency with a discharge status code indicating a need for skilled nursing care who received skilled nursing services within 30 days after discharge during the one-year reporting period. | |
|
Each entry in the FFS Hospital & Agency Sources table relates to a patient source for skilled nursing facilities. The table shows some comparative metrics. (See image below)
| ||
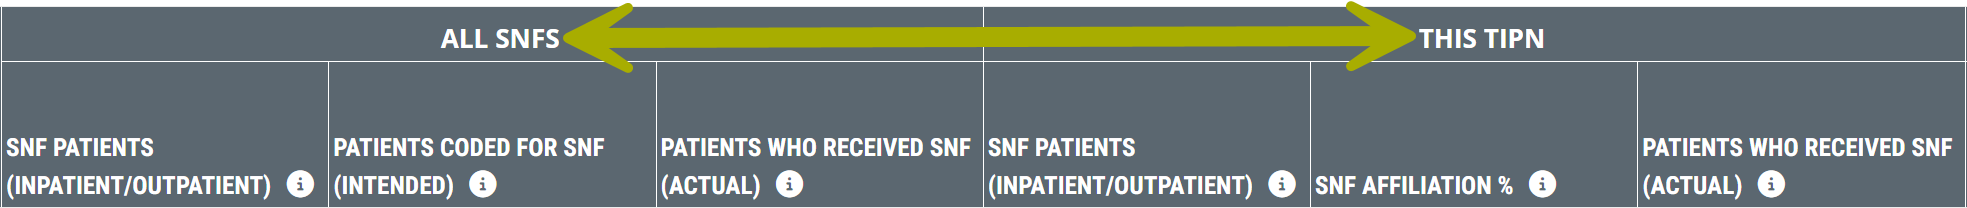 | ||
| This TIPN |
|
|
| SNF Patients (Inpatient/Outpatient) | The count of distinct Medicare FFS patients discharged from the listed hospital or agency who were admitted to a skilled nursing facility within the selected TIPN within 30 days after discharge during the one-year reporting period | |
| SNF Affiliation % | The percentage of distinct Medicare FFS patients discharged from the listed hospital or agency who were admitted to a skilled nursing facility within the selected TIPN within 30 days after discharge during the one-year reporting period | |
| Patients who Received SNF (Actual) | The count of distinct Medicare FFS patients who were discharged from the listed hospital or agency with a discharge status code indicating a need for skilled nursing care who were admitted to skilled nursing services at an SNF within the selected TIPN within 30 days after discharge during the one-year reporting period. | |
| Patient Counts | 20YY QX | The count of distinct patients discharged from the listed hospital or agency who were admitted to a skilled nursing facility within the selected TIPN during the quarter listed in the header. |
FFS Physician Sources
The physician sources listed in this table are those who treated patients who were admitted to a skilled nursing facility aligned with the selected TIPN.
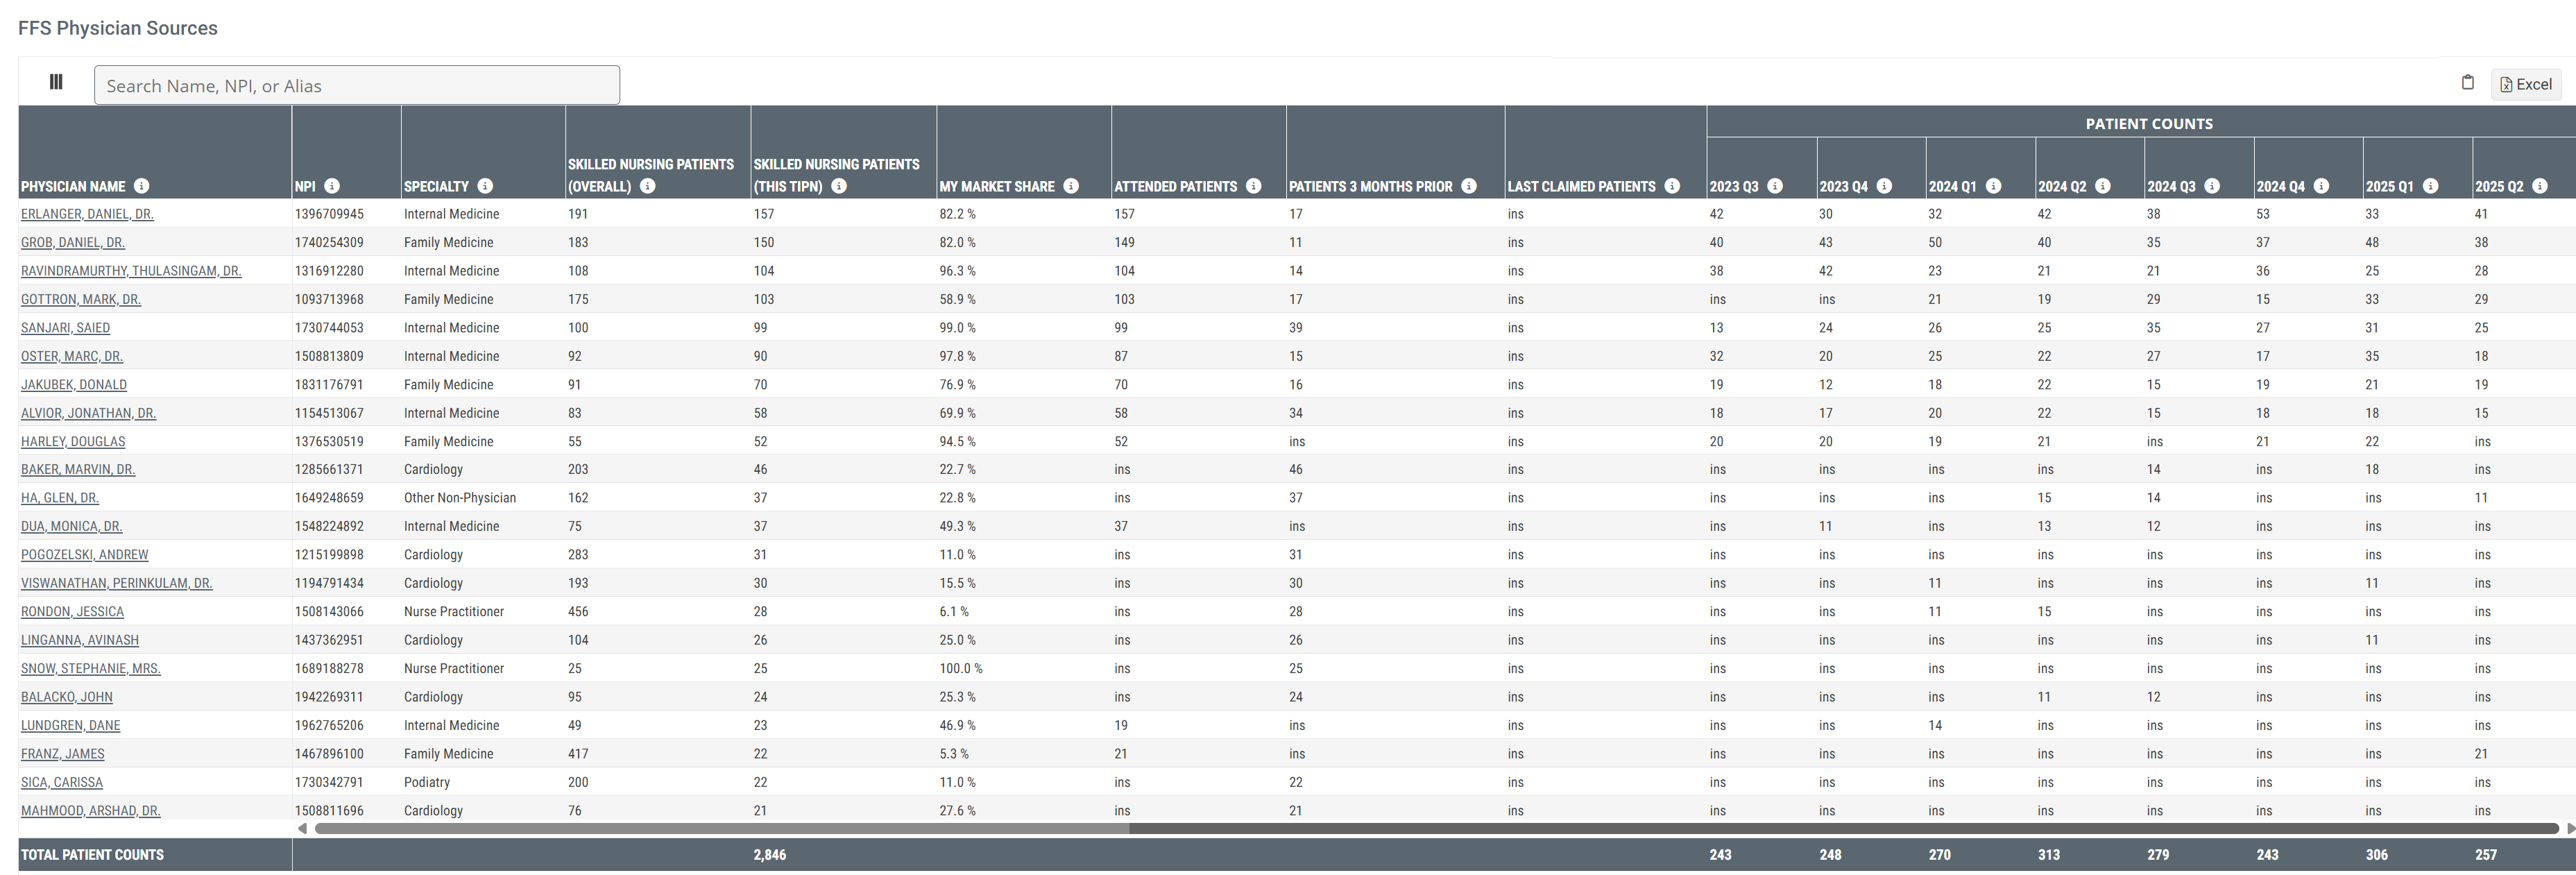
![]() Click on the image to enlarge it.
Click on the image to enlarge it.
Understanding the Metrics
Metric Name |
Description |
|
| Physician Name | The name of the physician for which the metrics in the row apply, taken from the CMS Provider Data (NPI) file. | |
| NPI | The physician's National Provider Identifier maintained by CMS. | |
| Specialty |
The physician's self-reported primary specialty, as listed in the NPI file.
|
|
| Skilled Nursing Patients (Overall) | The count of the listed physician's distinct patients who had claims filed for skilled nursing services at any skilled nursing facility. Includes patients seen by the physician within three months prior to skilled nursing admission, attended (by the physician on the skilled nursing claim), or last claimed (most recent physician to file a claim prior to skilled nursing care). | |
| Skilled Nursing Patients (This TIPN) |
The count of the listed physician's patients who had claims filed for skilled nursing services aligned with the selected TIPN. Includes patients seen by the physician within three months prior to skilled nursing admission, attended (by the physician on the skilled nursing claim), or last claimed (most recent physician to file a claim prior to skilled nursing care). This count is a subset of the prior metric skilled nursing Patients (Overall) |
|
| My Market Share |
The percentage of total skilled nursing patients for the listed physician who were admitted to a skilled nursing facility aligned with the selected TIPN during the one-year reporting period.
|
|
|
These metrics pertain to SNF patients treated by the listed physician who were admitted to a SNF aligned with the selected TIPN. The union of these counts is shown in the column Skilled Nursing Patients (This TIPN).
|
Attended |
The count of Medicare FFS Patients admitted to a skilled nursing facility aligned with the selected TIPN during the one-year reporting period where the listed physician was identified as the attending physician. |
| Patients 3 Months Prior | The count of Medicare FFS Patients treated by the listed physician within three months prior to entering skilled nursing services at any skilled nursing facility aligned with the selected TIPN. | |
| Last Claimed Patients | The count of Medicare FFS Patients at any skilled nursing facility aligned with the selected TIPN where this physician submitted the last claim prior to the patient's skilled nursing admission. | |
|
Patient Counts Eight Quarters |
20YY QX |
These columns show the counts of the listed physician's distinct patients who had claims filed for skilled nursing services at any skilled nursing facility aligned with the selected TIPN during the quarter identified in the header. Includes patients seen by the physician within three months prior to skilled nursing admission, attended (by the physician on the skilled nursing claim), or last claimed (most recent physician to file a claim prior to skilled nursing care).
|