 Let's get Oriented
- The location of the table in Trella Insights
- The value of the table
- Summary of the metrics
- Any additional useful details
 In this article
Use the links to jump directly to specific content.
- Medicare Advantage data in Trella Insights for Skilled Nursing
- Metrics on the Explore page
- Tables on the Analyze pages
- Hospitals & Agencies Analyze - Vendor Medicare Advantage SNF Destinations by Payer
- Hospitals & Agencies Analyze - Vendor Medicare Advantage Patient Volume
- Skilled Nursing Analyze - Vendor Medicare Advantage Facility Sources by Payer
- Skilled Nursing Analyze - Vendor Medicare Advantage Patient Volume
- Physician Analyze - Vendor Medicare Advantage SNF Destinations
- Physician Analyze - Vendor Medicare Advantage Patient Volume
Medicare Advantage data in Trella Insights
 Value
Value
Using the Medicare Advantage metrics included in Trella Insights will allow you to:
-
Identify high-value MA referral sources
- Know which hospitals and physicians are referring MA patients to skilled nursing facilities.
- View the volume of MA patients vs. other payers to uncover referral patterns and target providers with favorable payers.
-
Monitor referral leakage and strengthen relationships
- Analyze patient volumes and track where your referrals are going to reduce leakage, focus your outreach, and prove your value to key referral sources.
-
Make smarter contracting decisions
- Leverage insights into competitors’ referral patterns, payer mix, and affiliation strength to inform your strategy.
FAQs
 Where does the data come from?
Trella Health has contracted with a data provider to get the most up-to-date data possible from which we create the metrics found in Trella Insights.
When is the data released?
MA data is released quarterly at the earliest possible time given time required to compile and analyze the data.
 Table entries labeled "Unknown"
Our data provider sometimes redacts information from claims before delivering the data to us. When that happens, we produce what metrics we can from the data and label the results as coming from an unknown source.
Metrics on the Explore page
Two Medicare Advantage metrics are included on the Explore page in Trella Insights for Skilled Nursing.
Explore page |
Metric name |
Image |
| Physicians Explore page | Vendor Annual Patient Count (MA) | 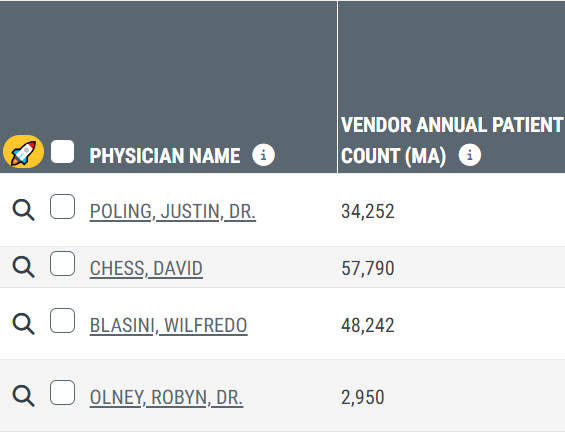 |
| Skilled Nursing Explore page | Vendor Annual Patient Count (MA) | 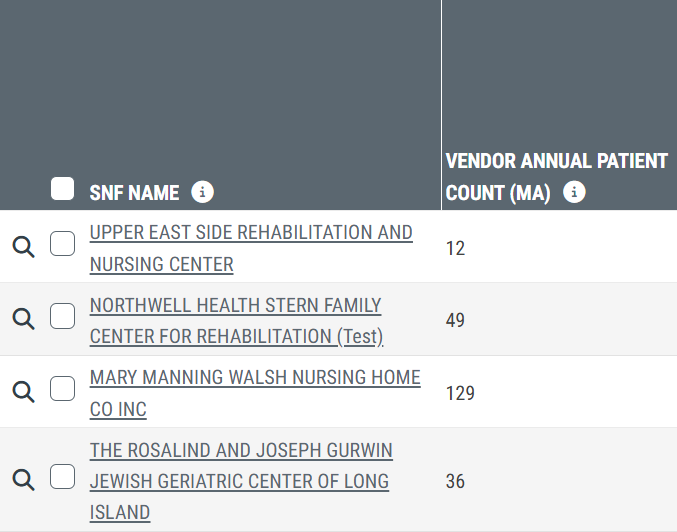 |
 Definition
The metrics in these columns are counts of distinct patients treated by the listed provider during the most recent one-year reporting period.
Value
These two metrics will help you to identify physicians or skilled nursing facilities that are actively engaging with Medicare Advantage enrollees. Moreover, since these metrics are presented side-by-side with Medicare FFS patient counts, it is easy to make a quick comparison of the payer mix.
Tables on the Analyze page
Hospitals & Agencies Analyze - Vendor Medicare Advantage SNF Destinations by Payer
 Table Summary
The Vendor Medicare Advantage SNF Destinations by Payer table displays metrics for skilled nursing facilities that admitted patients treated by the selected hospital or agency during the one-year reporting period. A dropdown table for each skilled nursing facility provides a list of the MA payers for the patients admitted to the listed SNF.
Value
Use this table to get a detailed view of where hospital's & home health agency's Medicare Advantage patients are going, broken down by admitting SNF and payer. Analyze affiliation strength, patient volume, and payer alignment to assess market positioning and inform strategic partnerships, contracting, and competitive positioning.
 Location
The Vendor Medicare Advantage SNF Destinations by Payer table can be found on the Hospitals & Agencies Analyze page under the Destinations tab (see box in image).
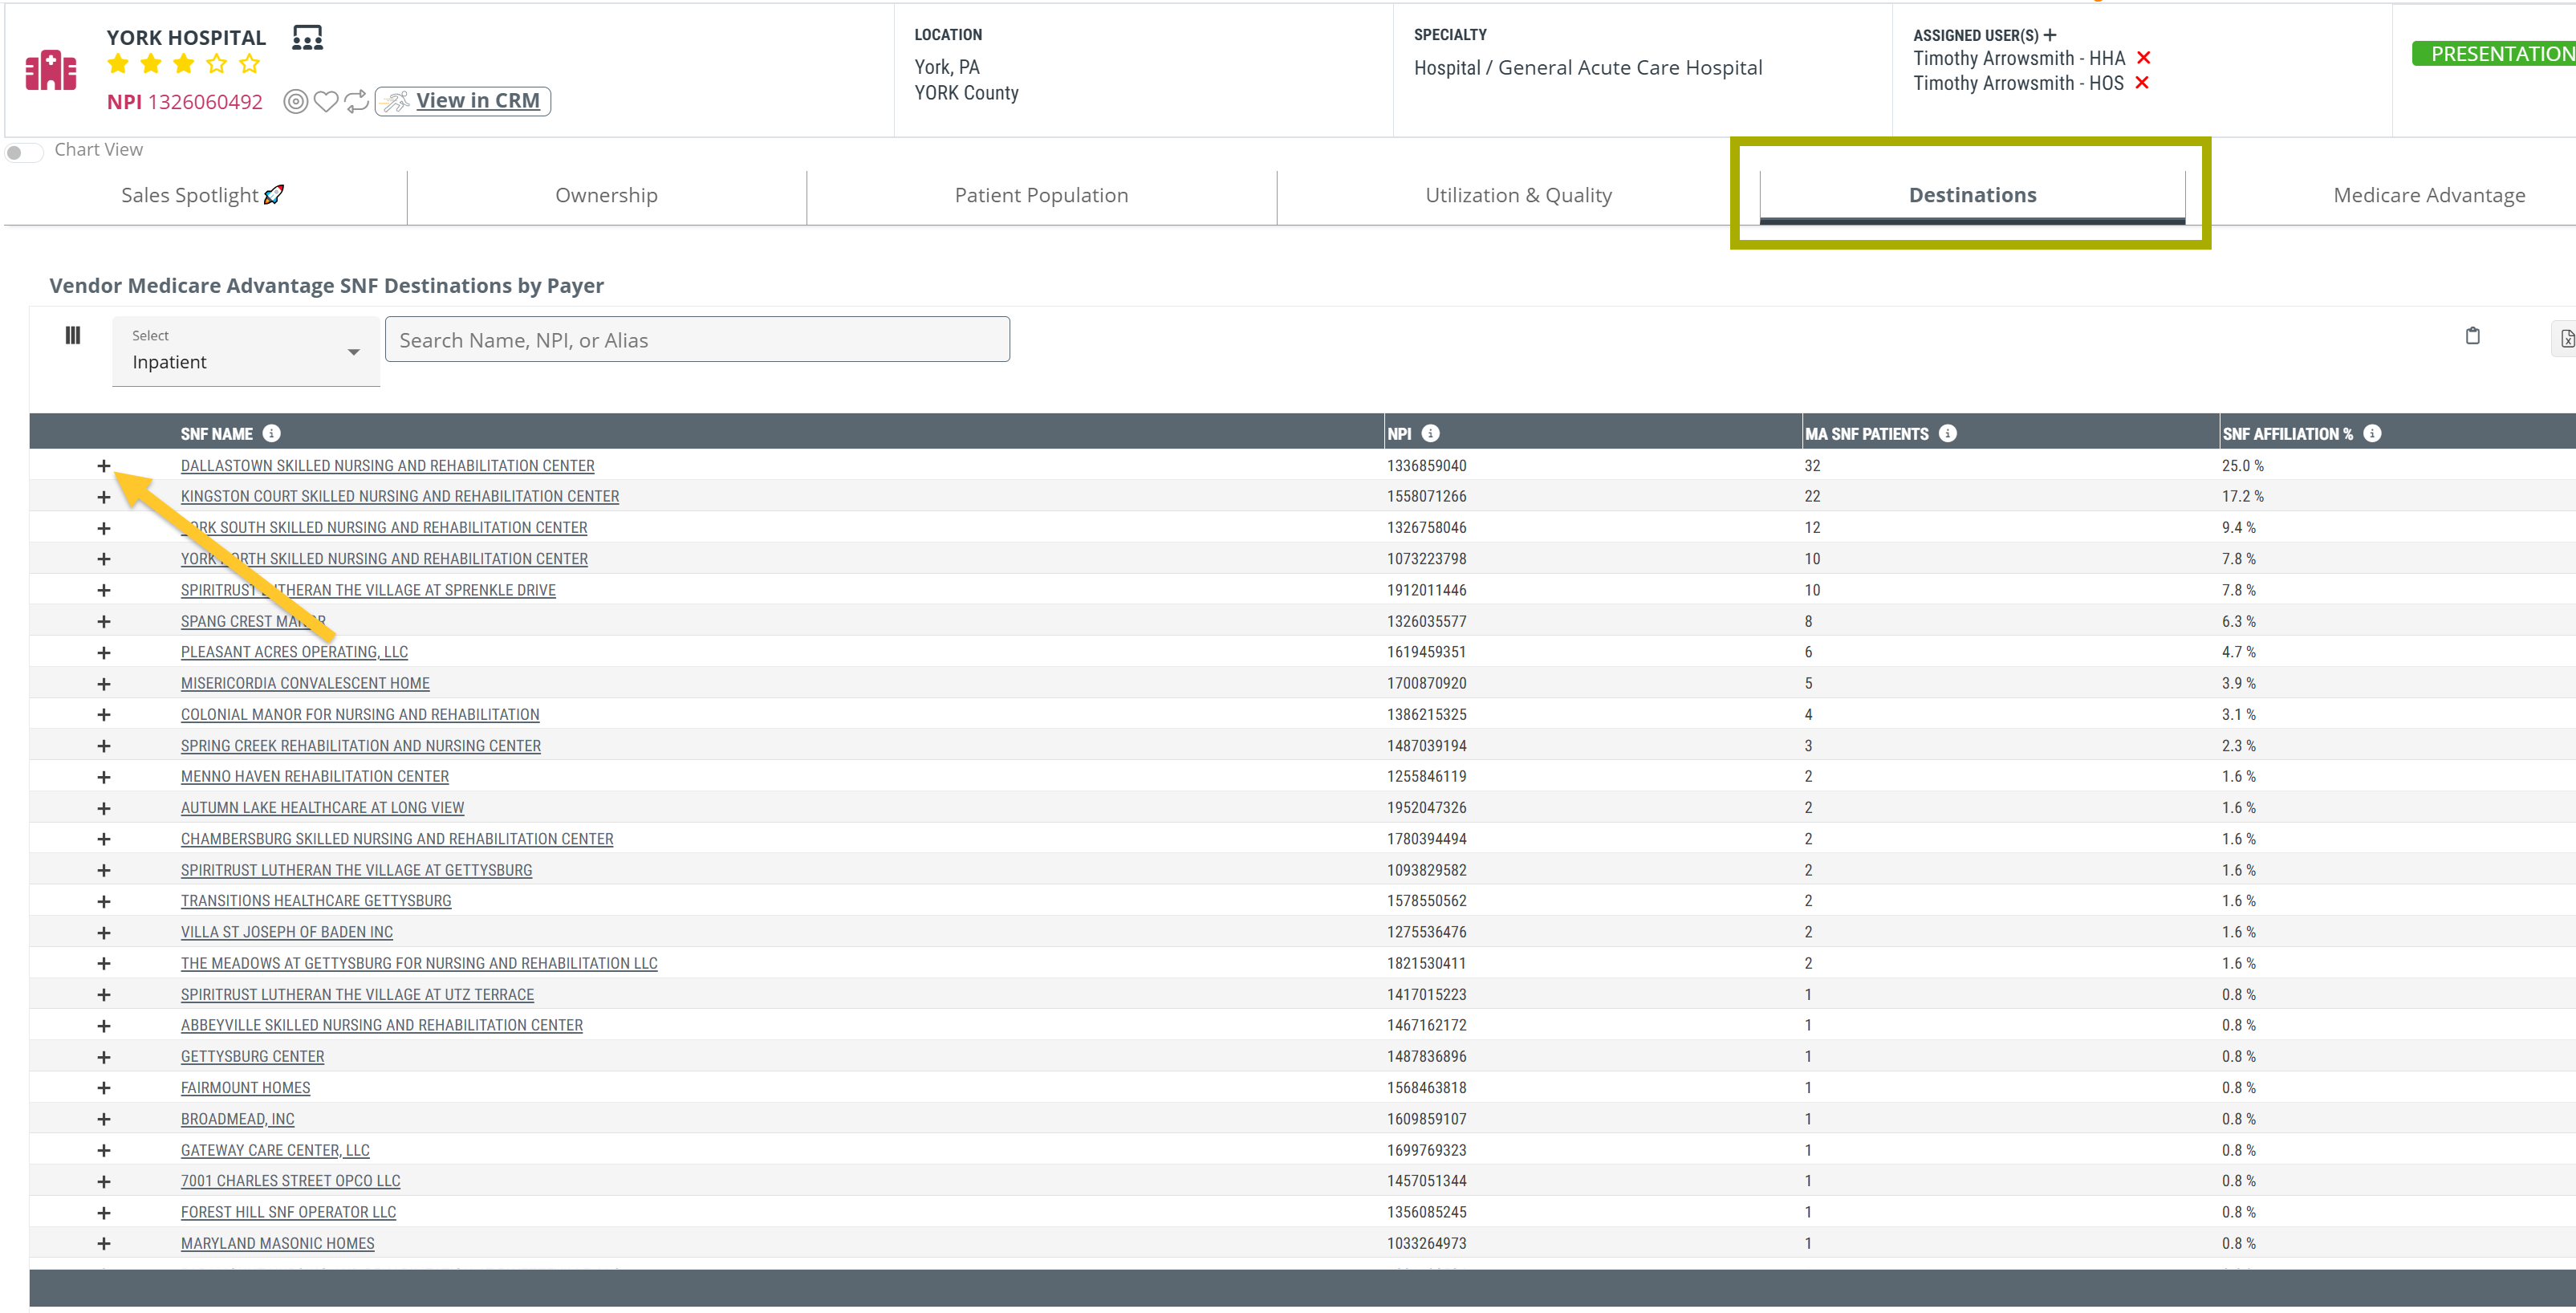
The "+" to the left of the facility's name will open to show the Medicare Advantage payers associated with the claims used to generate the metrics. (See Show Payer Table - below)
Understanding the Metrics
The following table includes summary definitions for the metrics in the Vendor Medicare Advantage SNF Destinations by Payer table.
Metric |
Definition |
| SNF Name | The name of the skilled nursing facility taken from the CMS NPI Registry |
| NPI | The NPI for the skilled nursing facility listed in the row |
| MA SNF Patients | The number in this column is the count of distinct Medicare Advantage patients who were discharged from the selected hospital/agency and admitted to the listed SNF within 30 days after discharge during the one-year reporting period |
| SNF Affiliation % | This column includes the percentage of distinct Medicare Advantage patients discharged from the selected hospital/agency who were admitted to the listed SNF within 30 days after discharge during the one-year reporting period |
 Details
Inpatient/Outpatient Claims
Use the selector at the top left to choose whether the table displays data related to inpatient or outpatient claims.
![]() Please don't try to add counts of inpatient and outpatient patients to get a "total." Many patients with inpatient claims will also have outpatient claims, and will be counted twice if you do so.
Please don't try to add counts of inpatient and outpatient patients to get a "total." Many patients with inpatient claims will also have outpatient claims, and will be counted twice if you do so.
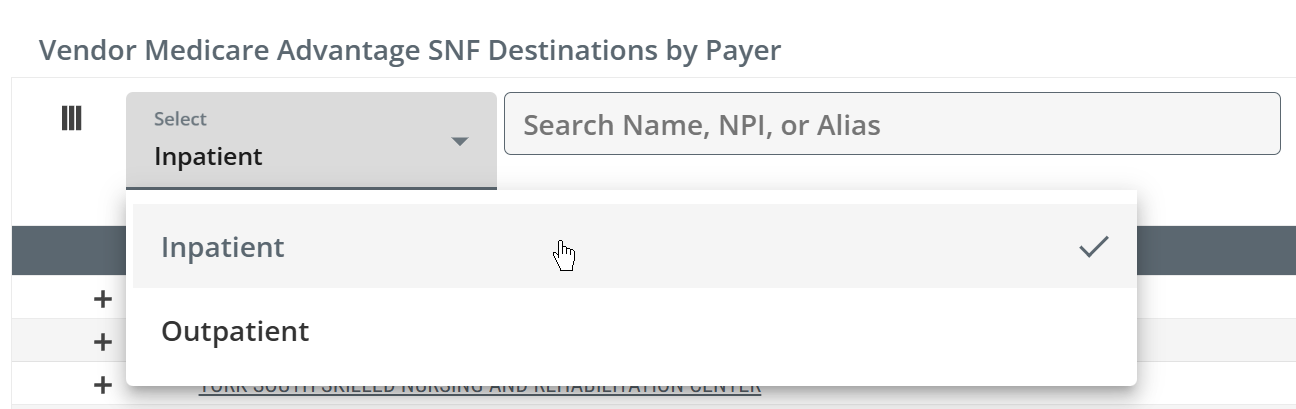
![]() If you know the name or NPI of the skilled nursing facility you want to examine, you can type it into the table search box.
If you know the name or NPI of the skilled nursing facility you want to examine, you can type it into the table search box.
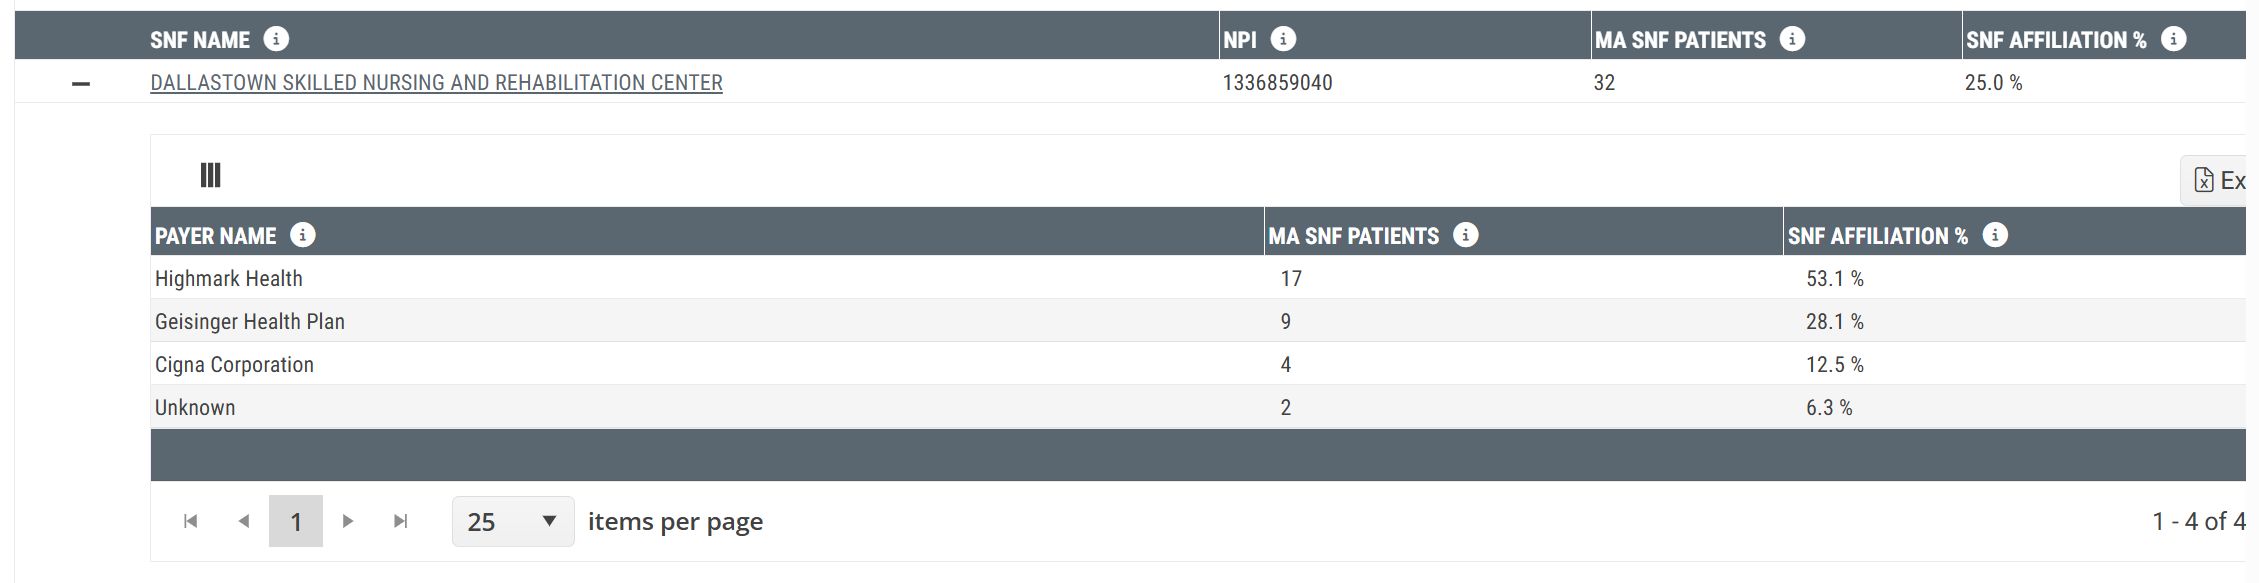
Show Payer Table
When you click on the "+" to the left of the listed facility's name, a table will open up that reveals the payers associated with the claims used to generate the metrics.
The following table includes summary definitions for the metrics in the Payer table.
Metric |
Definition |
| Payer Name | Name of the primary payer identified on the claim; from Trella’s vendor MA dataset |
| MA SNF Patients | This metric is the count of distinct Medicare Advantage patients who were discharged from the selected hospital/agency and admitted to the listed SNF within 30 days after discharge during the one-year reporting period where the listed payer was identified as the primary payer on the claim |
| SNF Affiliation % | This metric is the percentage of distinct Medicare Advantage patients discharged from the selected hospital/agency who were admitted to the listed SNF within 30 days after discharge and during the one-year reporting period where the listed payer was identified as the primary payer on the claim |
Hospitals & Agencies Analyze - Vendor Medicare Advantage Patient Volume
Table Summary
The Vendor Medicare Advantage Patient Volume table shows patient counts for Medicare Advantage patients treated by the selected hospital or agency broken out by the different MA payers.
Value
The metrics in the Vendor Medicare Advantage Patient Volume table help you to prioritize high-impact referral partners by understanding the volume of MA patients and MA payer names. You can better align with hospitals and home health agencies that treat your target MA audience. (E.g., if you are targeting Humana MA patients, understand the hospitals and home health agencies that are treating those patients)
Location
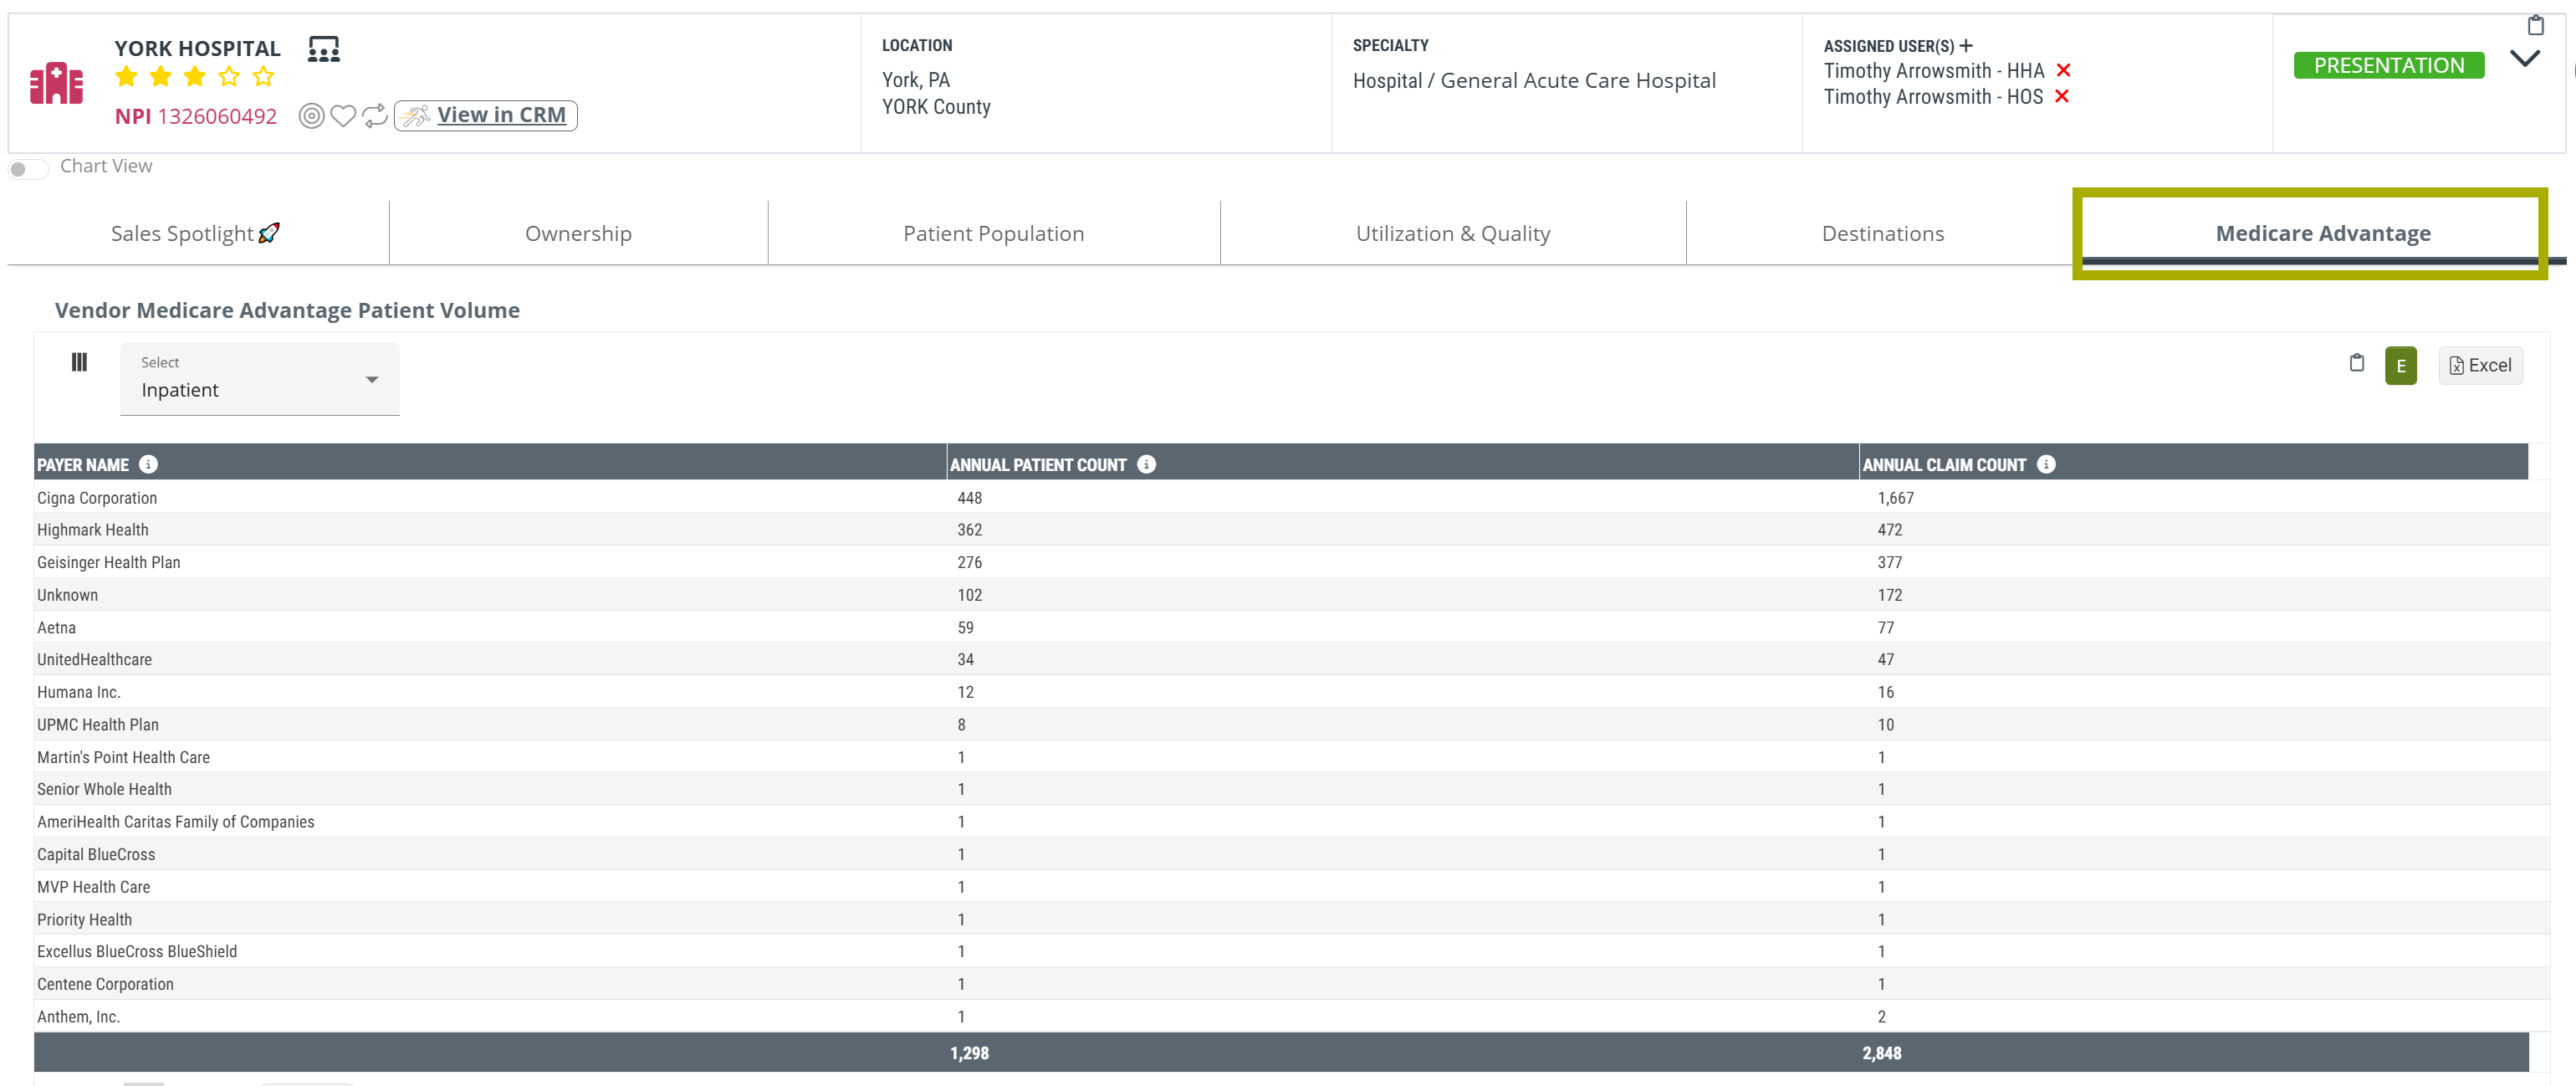
The Vendor Medicare Advantage Patient Volume table can be found on the Hospitals & Agencies Analyze page under the Medicare Advantage tab (see box in image).
Understanding the Metrics
The following table includes summary definitions for the metrics in the Vendor Medicare Advantage Patient Volume table.
Metric |
Definition |
| Payer Name | The name of the primary payer identified on the claim from Trella's Vendor MA data |
| Annual Patient Count | This metric is the count of distinct Medicare Advantage patients treated by the selected hospital/agency during the one-year reporting period (ending in the latest quarter of data available) where the listed payer was identified as the primary payer on the claim |
| Annual Claim Count | This metric is the count of Medicare Advantage claims submitted by the selected hospital/agency during the one-year reporting period (ending in the latest quarter of data available) where the listed payer was identified as the primary payer on the claim |
Details
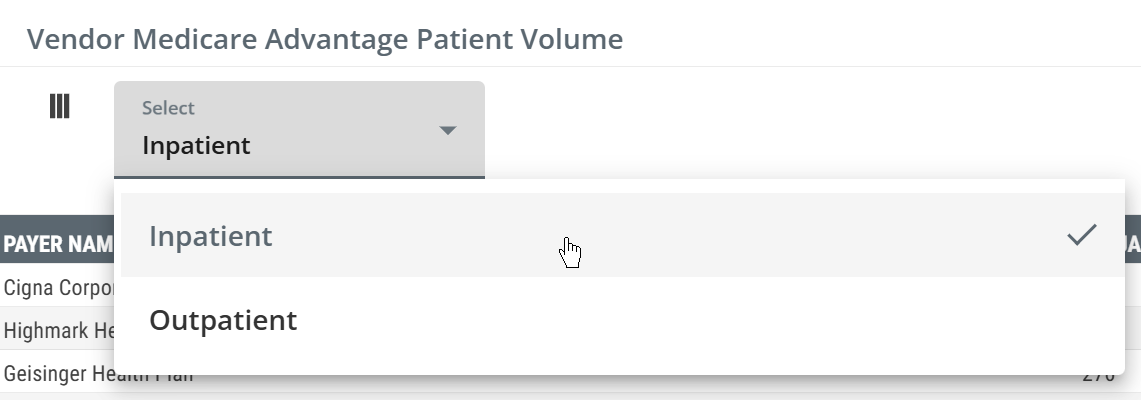
Inpatient/Outpatient Claims
Use the selector at the top left to choose whether the table displays data related to inpatient or outpatient claims.
![]() Please don't try to add counts of inpatient and outpatient patients to get a "total." Many patients with inpatient claims will also have outpatient claims, and will be counted twice if you do so.
Please don't try to add counts of inpatient and outpatient patients to get a "total." Many patients with inpatient claims will also have outpatient claims, and will be counted twice if you do so.
Skilled Nursing Analyze - Vendor Medicare Advantage Facility Sources by Payer
Table Summary
The Vendor Medicare Advantage Facility Sources by Payer table shows the hospital and agency patient sources for patients admitted to the selected skilled nursing facility. For each hospital or agency listed, a dropdown table reveals the MA payers for the claims.
Value
This table will help you to track where Medicare Advantage patients are coming from as admissions for the selected skilled nursing facility — by facility and plan. You will be able to better understand your competitors’ referral patterns, payer mix, and affiliation strength to make smarter strategic decisions.
Location
The Vendor Medicare Advantage Facility Sources by Payer table can be found on the Skilled Nursing Analyze page under the Sources tab (see box in image).
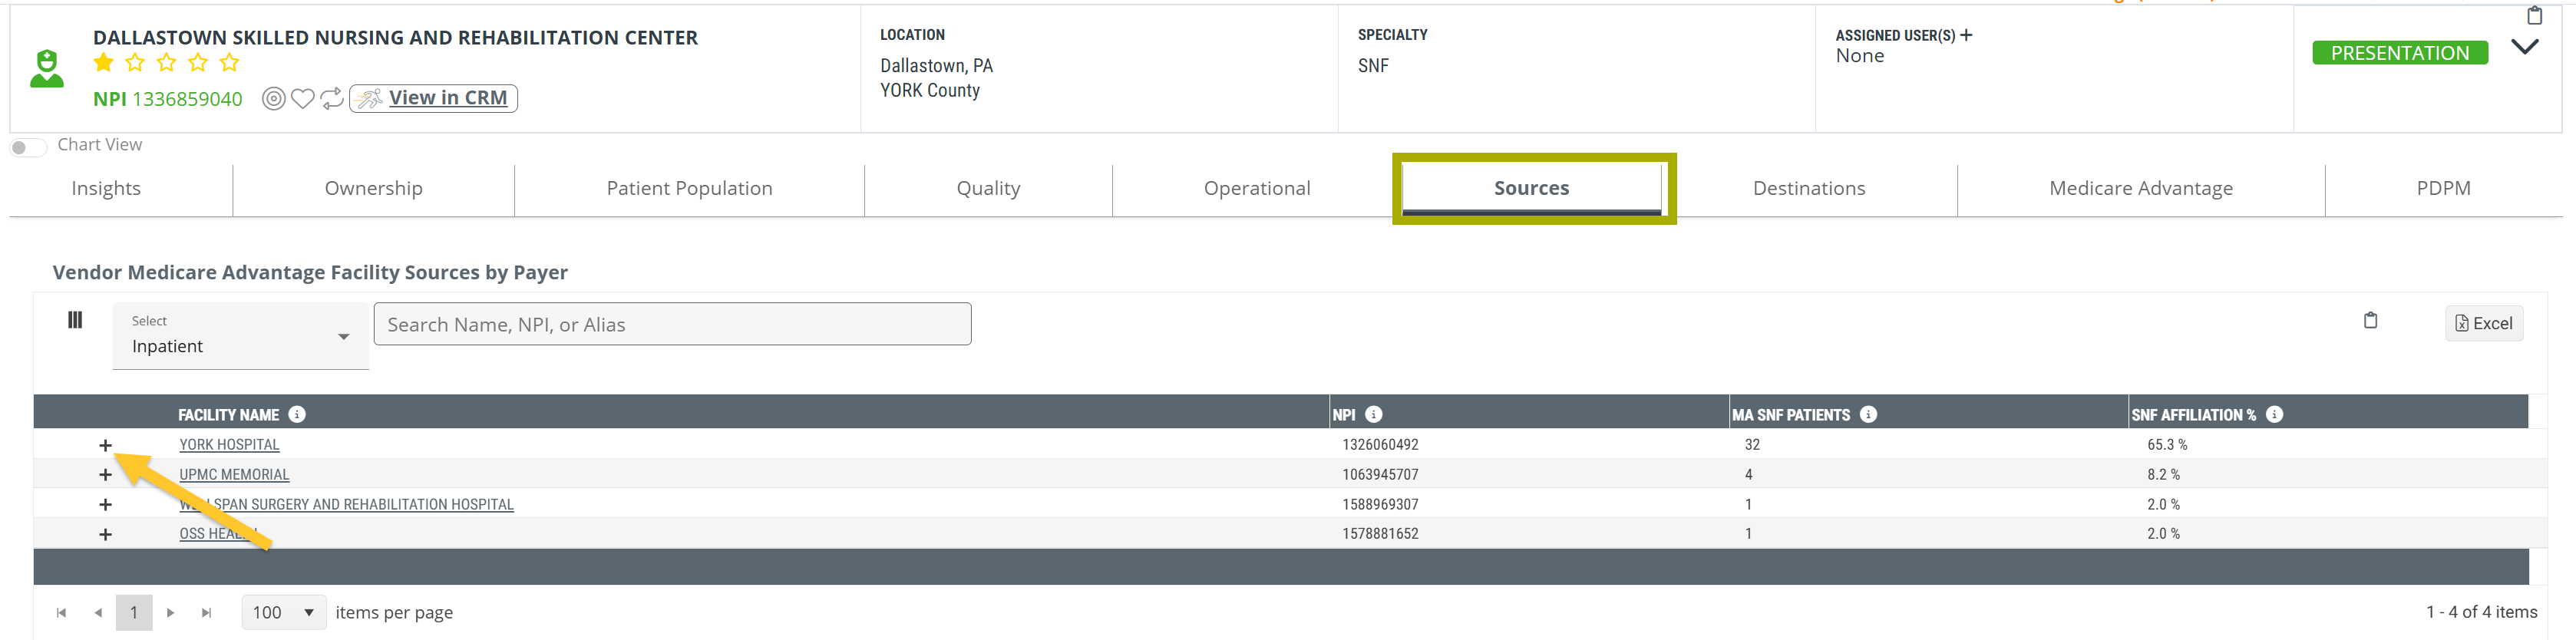
The "+" to the left of the facility's name will open to show the Medicare Advantage payers associated with the claims used to generate the metrics. (See Show Payer Table - below)
Understanding the Metrics
The following table includes summary definitions for the metrics in the table.
Metric |
Definition |
|
Facility Name (hospital or agency) |
The hospital's or agency's name from the CMS NPI Registry. |
| NPI | The hospital's or agency's NPI from the CMS NPI Registry. |
| MA SNF Patients | For the listed hospital/agency, this metric is the count of distinct Medicare Advantage patients who were discharged from the listed hospital/agency and admitted to the selected SNF within 30 days after discharge during the one-year reporting period |
| SNF Affiliation % | For the listed hospital/agency, this metric is the percentage of distinct Medicare Advantage patients discharged from the listed hospital/agency who were admitted to the selected SNF within 30 days after discharge during the one-year reporting period |
Details
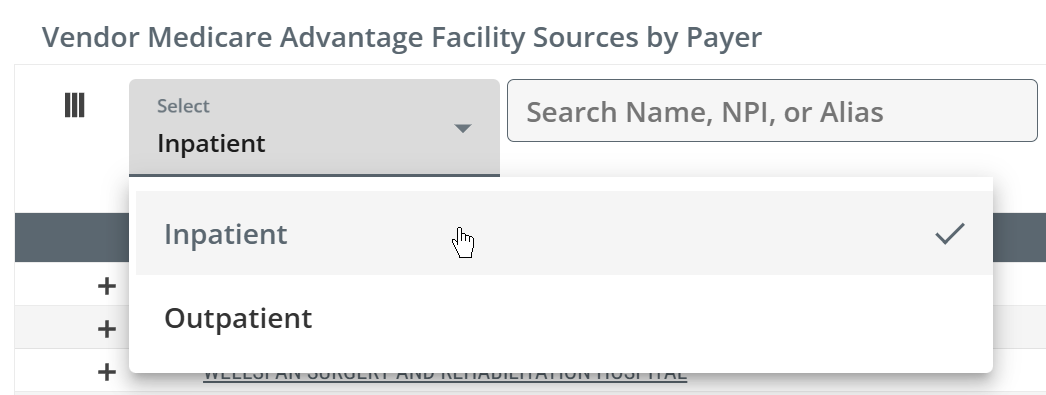
Inpatient/Outpatient Claims
Use the selector at the top left to choose whether the table displays data related to inpatient or outpatient claims.
![]() Please don't try to add counts of inpatient and outpatient patients to get a "total." Many patients with inpatient claims will also have outpatient claims, and will be counted twice if you do so.
Please don't try to add counts of inpatient and outpatient patients to get a "total." Many patients with inpatient claims will also have outpatient claims, and will be counted twice if you do so.
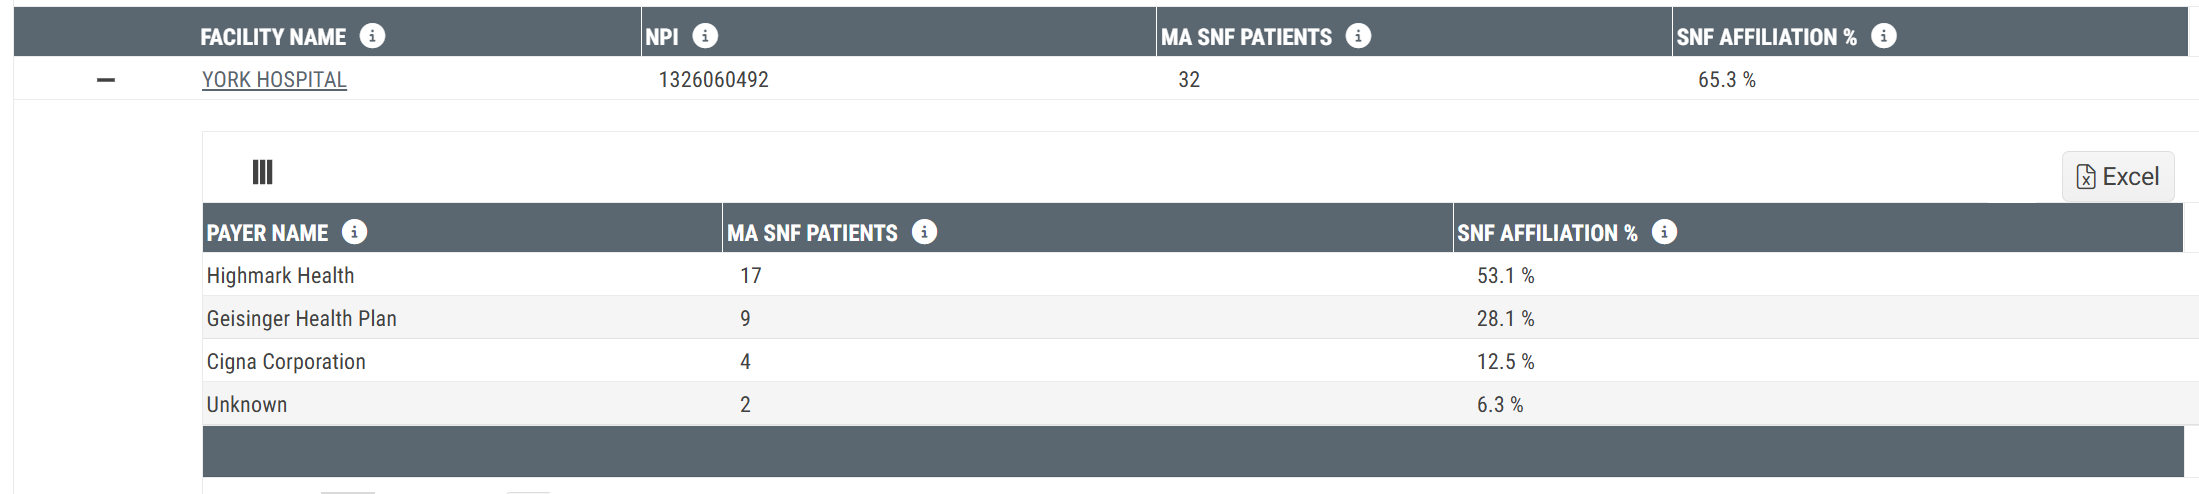
Show Payer Table
When you click on the "+" to the left of the listed hospital's or agency's name, a table will open up that reveals the payers associated with the claims used to generate the metrics.
Metric |
Definition |
| Payer Name | The name of the primary payer identified on the claim; from Trella's Vendor MA dataset |
| MA SNF Patients | This metric is the count of distinct Medicare Advantage patients who were discharged from the listed hospital/agency and admitted to the selected SNF within 30 days after discharge during the one-year reporting period where the listed payer was identified as the primary payer on the claim |
| SNF Affiliation % | This metric is the percentage of distinct Medicare Advantage patients discharged from the listed hospital/agency who were admitted to the selected SNF within 30 days after discharge during the one-year reporting period where the listed payer was identified as the primary payer on the claim |
Skilled Nursing Analyze - Vendor Medicare Advantage Patient Volume
Table Summary
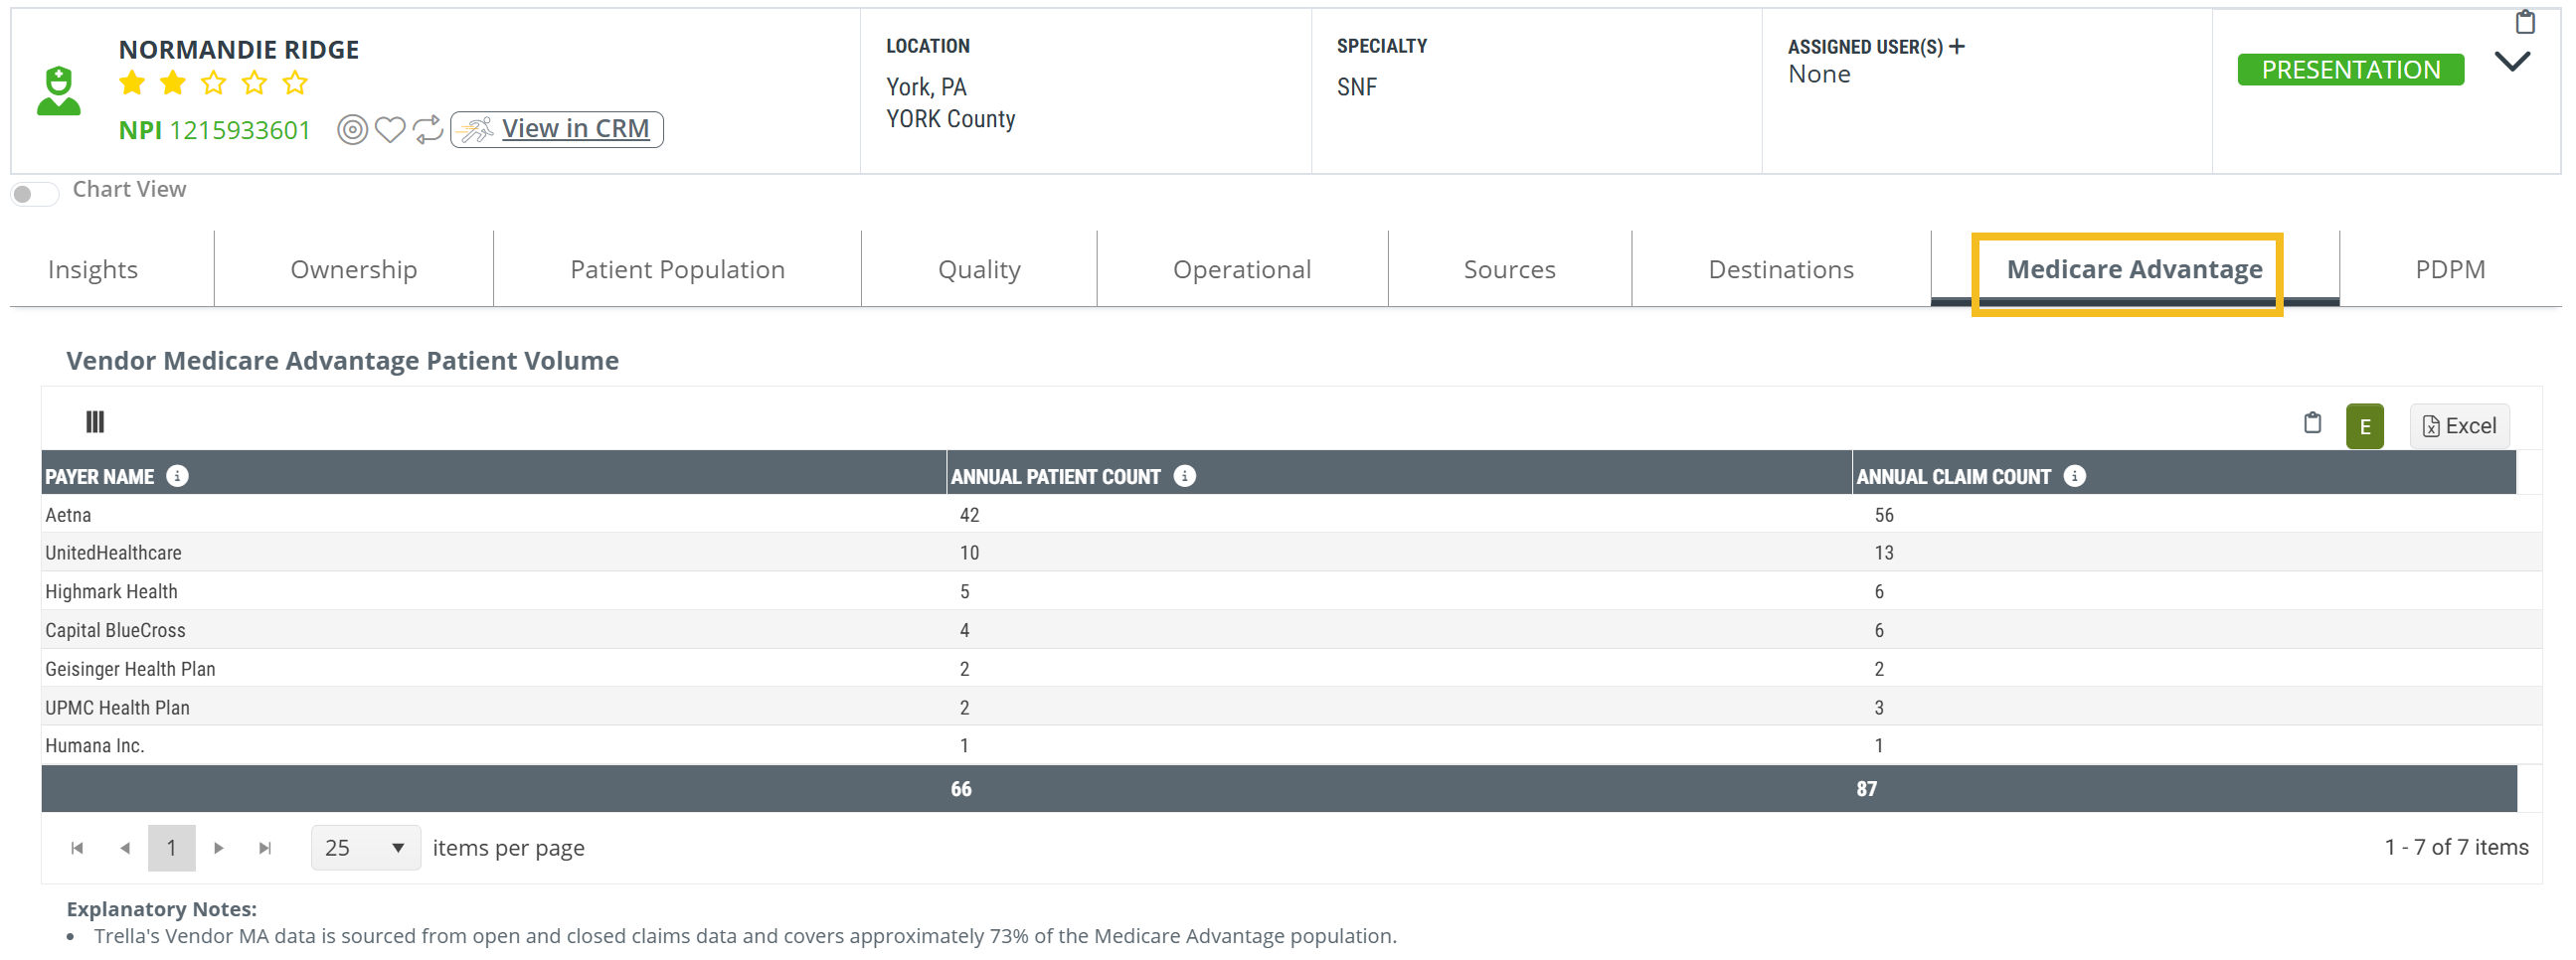
For the selected skilled nursing facility, the Vendor Medicare Advantage Patient Volume table shows the breakout of payers for patients admitted for skilled nursing care with patient counts and counts of claims.
Value
Whether you are viewing your own facility or a competitor, the payer mix breakout in the Vendor Medicare Advantage Patient Volume table reveals patient volumes for all MA payers for patients treated by the selected facility. Understanding your competitor's Medicare Advantage payer mix can help you to define targeting strategies and to identify growth opportunities across payers.
Location
The Vendor Medicare Advantage Patient Volume table can be found on the Skilled Nursing Analyze page under the Medicare Advantage tab (see box in image).
Understanding the Metrics
The following table includes summary definitions for the metrics in the table.
Metric |
Definition |
| Payer Name | This column shows the name of the primary payer listed on the claim from Trella’s Vendor Medicare Advantage data. |
| Annual Patient Count | The count of distinct Medicare Advantage patients treated by the selected skilled nursing facility during the most recent one-year reporting period where the listed payer was identified as the primary payer on the claim. |
| Annual Claim Count | The metrics in this column are the count of Medicare Advantage claims submitted by the selected skilled nursing facility during the most recent one-year reporting period where the payer was listed as the primary payer on the claim. |
Physician Analyze - Vendor Medicare Advantage SNF Destinations
Table Summary
The Vendor Medicare Advantage SNF Destinations table shows the skilled nursing facilities that admitted Medicare Advantage patients treated by the selected physician. A dropdown table for each SNF reveals the specific MA payers for those patients.
Value
The Vendor Medicare Advantage SNF Destinations table shows the breakout of skilled nursing facilities that admitted patients treated by the selected physician. You can quickly identify your current position in the mix for the selected physician or identify a potential referral opportunity.
Location
The Vendor Medicare Advantage SNF Destinations table can be found on the Physician Analyze page under the Destinations tab (see box in image).
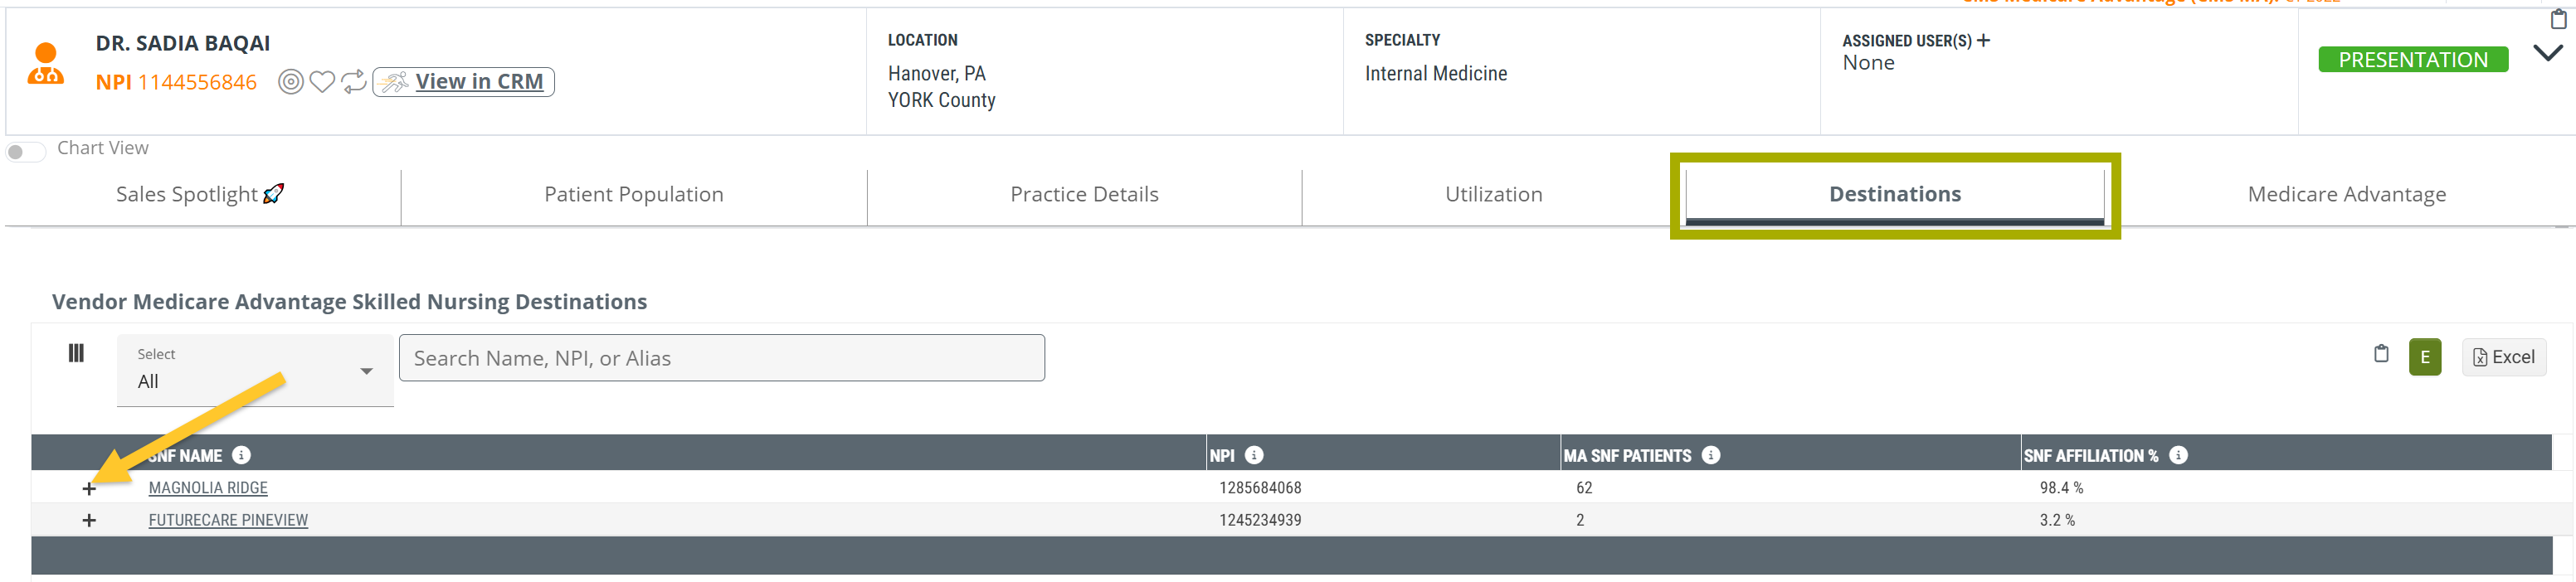
The "+" to the left of the facility's name will open to show the Medicare Advantage payers associated with the claims used to generate the metrics. (See Show Payer Table - below)
Understanding the Metrics
The following table includes summary definitions for the metrics in the table.
Metric |
Definition |
| SNF Name | The name of the skilled nursing facility that admitted Medicare Advantage patients who were treated by the selected physician - name from the CMS NPI Registry |
| NPI | The listed skilled nursing facility's NPI, from the CMS NPI Registry |
| MA SNF Patients | This column shows the count of distinct MA patients treated by the physician (Attended, 3 Months Prior, and Last Claimed patients) who received skilled nursing services from the listed skilled nursing facility during the one-year reporting period |
| SNF Affiliation | The metric in this column is the percentage of distinct MA patients treated by the physician (Followed, 3 Months Prior, and Last Claimed patients) who received skilled nursing services from the listed skilled nursing facility during the one-year reporting period |
Details
Claim Type
| Trella Health categorizes SNF claims for physicians into three types, Attended, 3 Months Prior, and Last Claimed. If you want to focus this table on a specific claim type, use the dropdown selector at the top-left of the table to do so. | 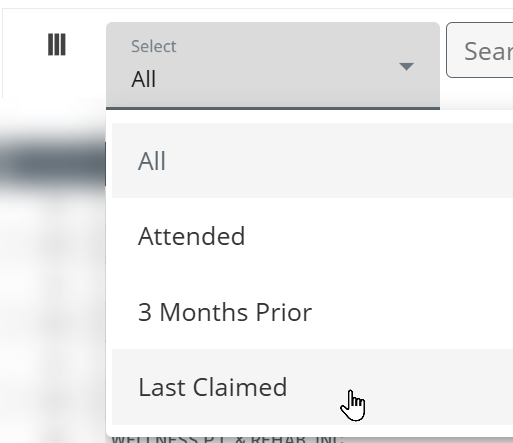 |
![]() For more information, see Patient Counts and Claim Types.
For more information, see Patient Counts and Claim Types.
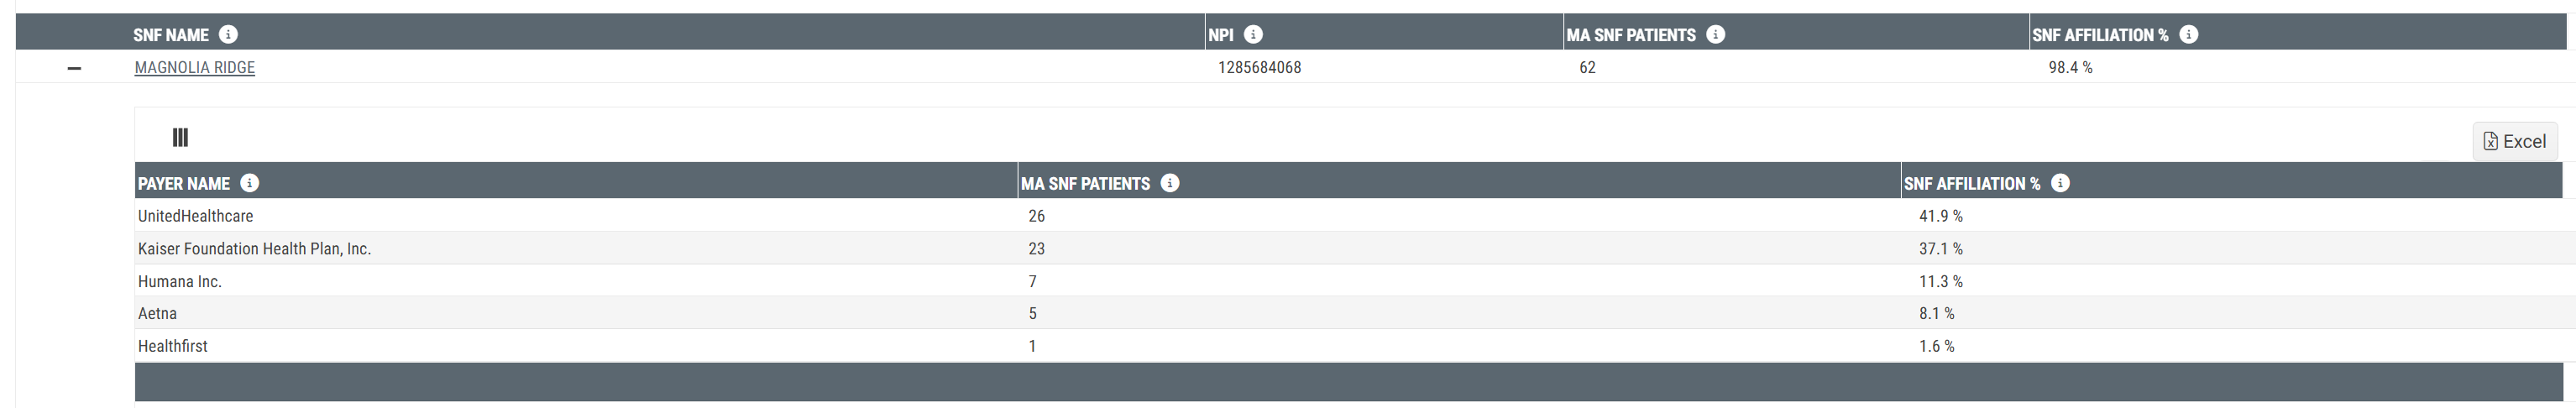
Show Payer Table
Metric |
Definition |
| Payer Name | The name of the primary payer listed on the claim from Trella's Vendor MA data |
| MA SNF Patients | This metric is the count of distinct MA patients treated by the selected physician (Attended, 3 Months Prior, and Last Claimed patients) who were admitted to the listed SNF during the one-year reporting period where the listed payer was identified as the primary payer on the claim |
| SNF Affiliation % | This metric is the percentage of distinct MA patients treated by the physician (Attended, 3 Months Prior, and Last Claimed patients) who were admitted to the listed SNF during the one-year reporting period where the payer was identified as the primary payer on the claim |
Physician Analyze - Vendor Medicare Advantage Patient Volume
Table Summary
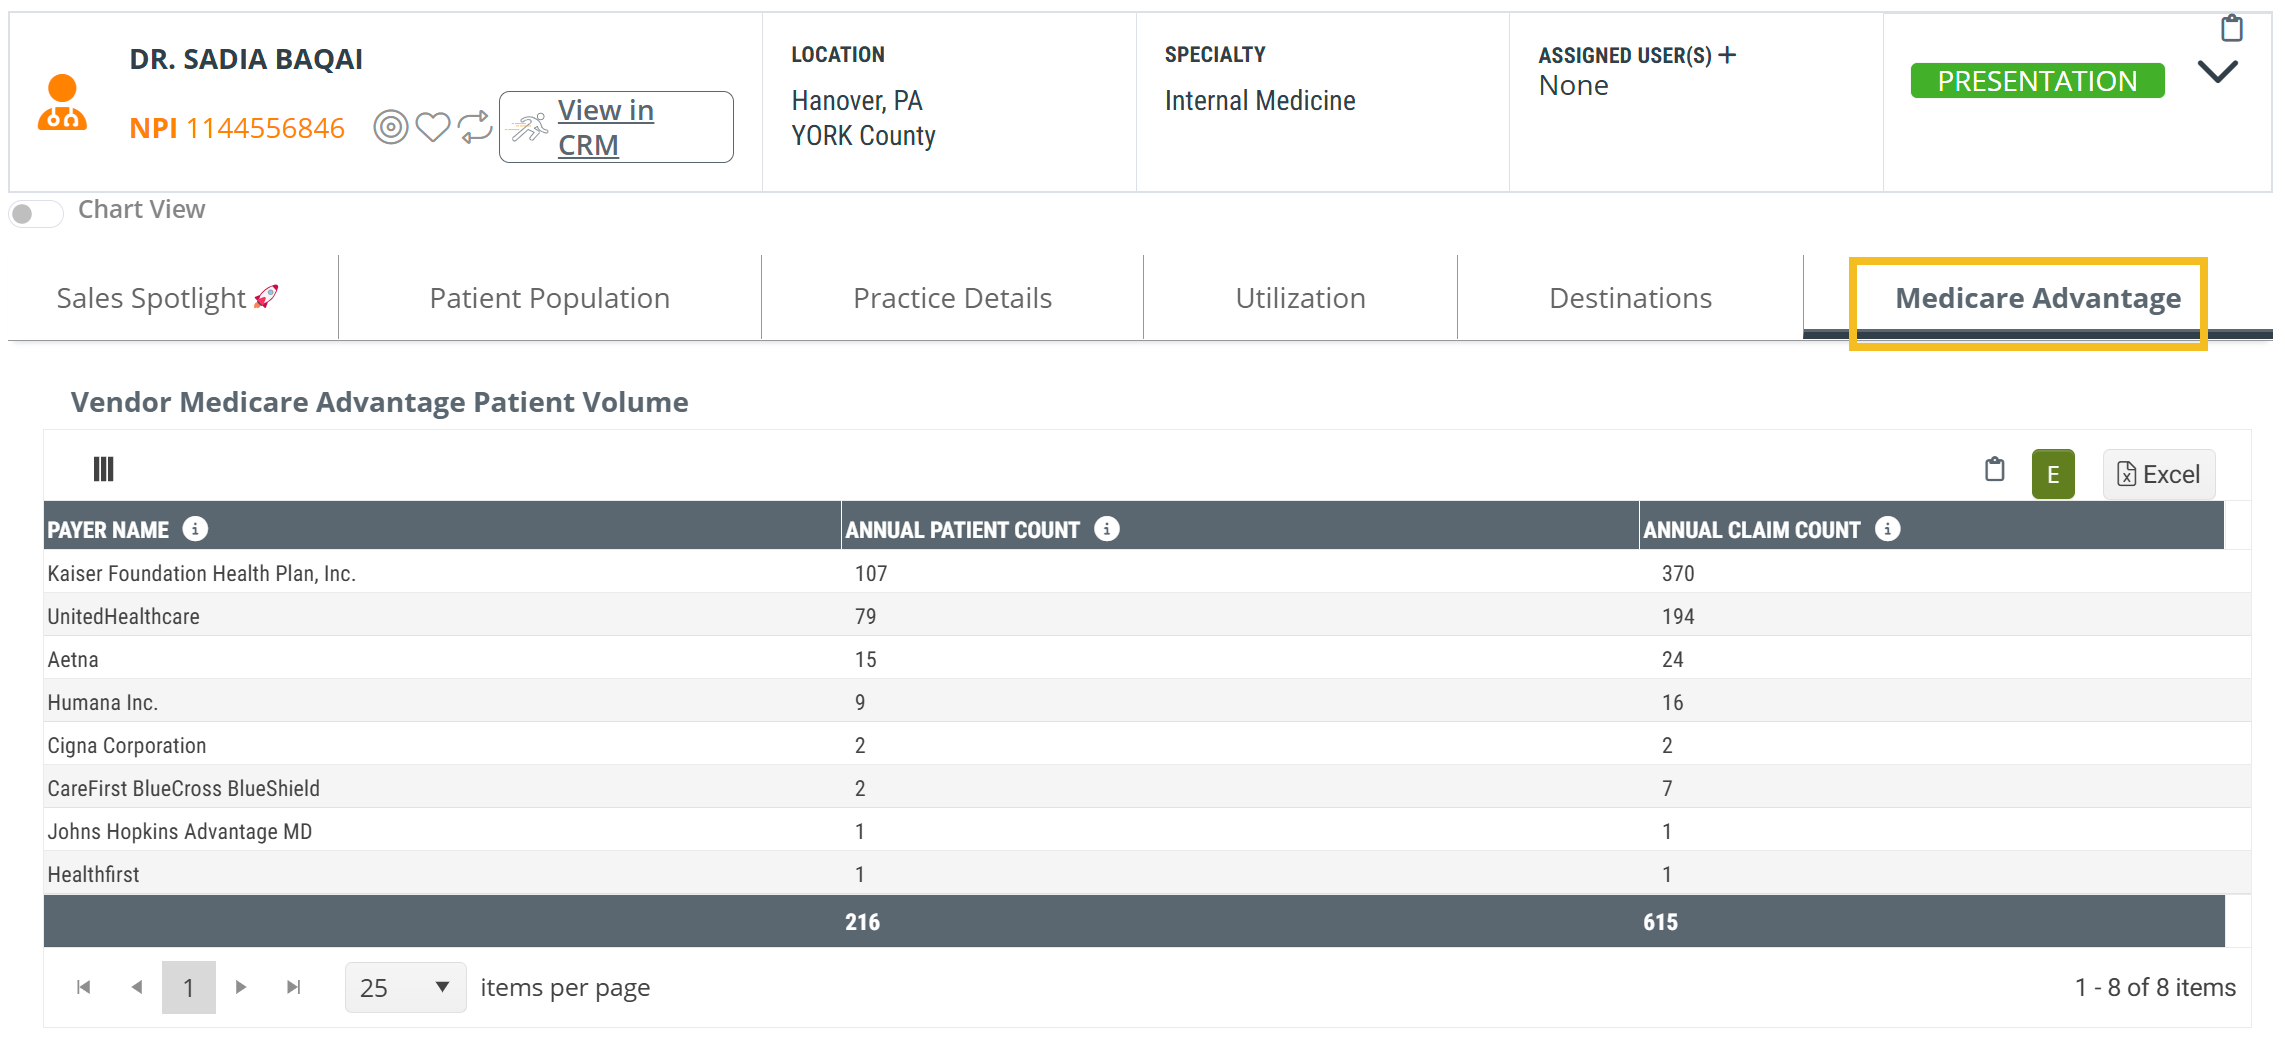
For the selected physician, the Vendor Medicare Advantage Patient Volume table shows the counts of patients treated by the physician broken out by the payers listed on the MA claims. Counts of claims are also included as a reference.
Value
This table helps you to evaluate the selected physician based on the volume of MA patients treated. Quickly identify which payers align with the largest number of patients for the selected physician. If you are targeting a specific Medicare Advantage patient population, you can see the relative patient volume for the physician and the potential value of a partnership.
Location
The Vendor Medicare Advantage Patient Volume table can be found on the Physician Analyze page under the Medicare Advantage tab (see box in image).
Understanding the Metrics
The following table includes summary definitions for the metrics in the table.
Metric |
Definition |
| Payer Name | The name of the primary payer listed on the claim from Trella's Vendor's MA data |
| Annual Patient Count | This column shows the count of distinct MA patients treated by the selected physician during the most recent one-year reporting period where the listed payer was the primary payer on the claim |
| Annual Claim Count | This column displays the count of MA claims submitted by the selected physician during the most recent one-year reporting period where the listed payer was the primary payer on the claim |