


Overview
The Sales Spotlight and the I email have two sections of metrics:
![]() Click on the Metric name to immediately navigate to the details for that metric.
Click on the Metric name to immediately navigate to the details for that metric.
- Top Physician Metrics - there are 5 metrics that might be visible in this section.
- Last Claimed - Count of distinct patients for which the physician submitted the last professional claim prior to the patient's SNF Admission during the one year reporting period.
- SNF Utilization - 3 Months Prior - Percentage of this physician's patients who received skilled nursing services during the one year reporting period and who were treated by the selected physician within three months of SNF admission.
- Highest Affiliation Facility - The facility where the highest percentage of the physicians patients were treated by the physician in an inpatient or outpatient setting during the one year reporting period.
- Patient Risk Score - The HCC risk scores are used to adjust cost relative to other NPIs of the same provider type.
- Top SNF Destinations - The three (or four) skilled nursing facilities that admitted the largest number of the selected physician's patients.
- Patient Volume - Counts of SNF patients and all Medicare Part B patients for the selected physician.
- Our Agency Relationship - There are only three metrics included. However, these metrics could be shown for different Diagnostic Groupings.
- Twelve-month Risk Adjusted Total Cost of Care following SNF - Average total risk-adjusted Medicare spend for patients during the six month period after SNF discharge.
- 30-Day Readmission Rate - Your agency's readmission rates for patients with the listed diagnosis.
- Average Medicare Days per Stay - The average number of days patients with a primary diagnosis in the named category were cared for by your SNF.
Section 1 - Top Physician Metrics
As the name implies, the metrics in this section of the Sales Spotlight or the Sales Spotlight email you will find some of the most helpful and insightful metrics to help you evaluate the selected Physician as a referral source.
What is in here?
The Physician Top Metrics in the Sales Spotlight tab on a Physician Analyze page and the content of the Sales Spotlight email are different. The table below shows the metrics and identifies which metric can be found in each location. In addition, when you click on Conversation Starters, most of the Top Metrics are removed and only the content from the email is revealed.
| Sales Spotlight Top Metrics on Analyze page | Sales Spotlight Top Metrice in email | |
|
Click on image to expand it
Each header below is a link to the details for that metric in the article below. |
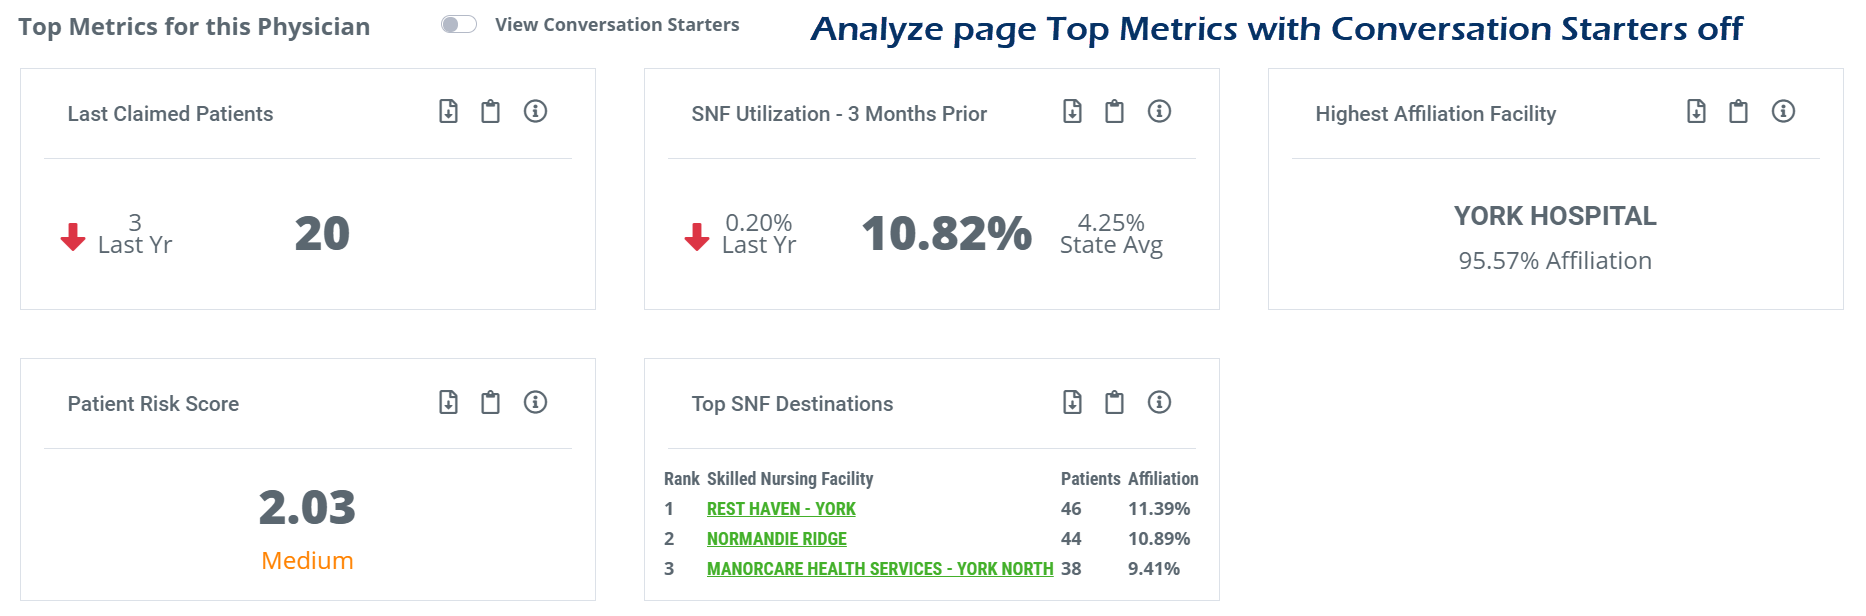
With Conversation Starters Off
With Conversation Starters On
|
|
| Patient Volume | Appears when you click on the Conversation Starters toggle. | |
| Last Claimed Patients | ||
| SNF Utilization | ||
| Highest Affiliation Facility | ||
| Patient Risk Score | ||
| Top SNF Destinations |


Last Claimed
|
Off |
On |
 |
Not shown on Analyze page |


 Usage
Usage
When a physician submits the last professional claim prior to SNF admission, it indicates an opportunity to be involved in the selection of specific SNF for care subsequent to the professional visit. A physician with a larger number of Last Claimed patients has a greater opportunity to make a referral to SNF.
 Definition
Last Claimed Patients - This is the count of distinct patients for which the selected physician submitted the last professional for that patient prior to SNF admission.
 |
To the left of the main metric, you will find an arrow pointing up or down that indicates whether this metric has increased or decreased for the selected physician since the prior year count. The number in the top row indicates the change. |
 Calculation
This metric is a count drawn directly from the selected physician's professional claims.
Reporting Period - This metric is calculated from a one-year reporting period.
 Where can I find this metric?
In addition to the Sales Spotlight tab, you can find these metrics:
- On the Explore page, in the row for the selected physician, although the metric is called Last Claimed Patients.
- On the Analyze page, under the Patient Population tab in the Patient Volume table under the name SNF Patients: Last Claimed.
Patient Volume
|
Off |
On |
| Not shown on Analyze page |
|

Usage
Simply, a physician who treats more patients has a greater potential as a source of new and ongoing referrals.
Definition
Skilled Nursing Patients - This is the count of distinct patients treated by a SNF during the most recent year who were counted for the selected physician as a 3 month prior, last claimed, or attended patient. For more on physician claim types, see Patient Counts and Claim Types.
Medicare Part B patients - This metric is called Annual Patient Count (FFS) everywhere else in Marketscape. This is the count of distinct Medicare FFS patients treated by the selected physician during the one year reporting period.
Metrics Calculation
These are both unique counts, although the Skilled Nursing Patients is also a union of three other counts, Attended Patients, Patients 3 Months Prior, and Last Claimed Patients.
Reporting Period - Both of these counts are from a one-year reporting period.
Where can I find this metric?
In addition to Conversation Starters on the Analyze page, you can find these metrics:
- On the Explore page. In the table, the metrics are called Physician SNF Patients, and Annual Patient Count (FFS).
- On the Analyze page, under the Patient Population tab in the Patient Volume table under the names Medicare FFS Patients, and SNF Patients (Overall).
- The SNF Patients count can be found under the Destinations tab as the "Distinct Patient Total, at the bottom of the SNF Destinations table.
SNF Utilization - 3 Months Prior
|
Off |
On |
 |
|

Definition
This metric is the percentage of the Physician's Medicare Patients (Annual Patient Count (FFS)) who were treated by the physician within three months of admission to a SNF.
Calculation
We calculate this metric from two other metrics. In general;

If you want to calculate the metric yourself, navigate to the Explore page for your selected physician and look at two metrics:

And use them in this equation:

Where can I find this metric?
This metric doesn't exist elsewhere in Marketscape. You can find quarterly utilization metrics on the Analyze page, under the Utilization tab in the Skilled Nursing Utilization table
Highest Affiliation Facility
|
Off |
On |
 |
Not shown on Analyze page |
Definition
This is the facility where the highest percent of the selected physician's patients were treated by the physician in an inpatient or outpatient setting during the one year reporting period. The highest affiliated facility is named and the patient percentage is included below the name.
Calculation
This metric is the percentage of the selected physician's distinct Medicare patients who were treated at the listed Facility.
Where can I find this metric?
In addition to the Sales Spotlight tab, you can find these metrics:
- On the Explore page in the row for your selected physician.
Patient Risk Score
|
Off |
On |
 |
Not shown on Analyze page |
Usage
In general, Risk Scores provide insight into the amount of care that can be expected for a patient population, and it helps calibrate a provider’s performance relative to its peers. The Risk score is an index number used for comparison. Based on the score for each provider, we assign a risk category, which is included under the number.
Definition
The HCC risk scores are used to adjust cost relative to other NPIs of the same provider type. Adjusted costs allow for better comparison across NPIs with different risk scores because it accounts for the increased cost of patients with chronic conditions.
Calculation
Trella Health uses CMS’s Hierarchical Condition Category (HCC) model to calculate Risk Scores.
Where can I find this metric?
In addition to the Sales Spotlight email, you can find these metrics:
- On the Explore page in the row for your selected physician.
![]() For more information, see Risk Scores and HCC.
For more information, see Risk Scores and HCC.
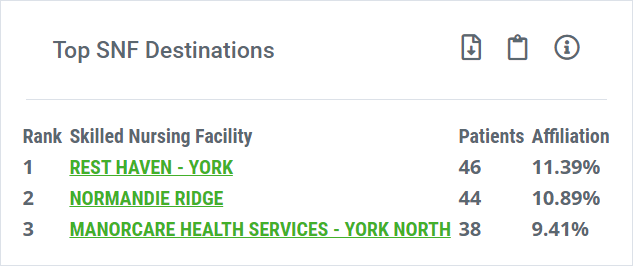
Top SNF Destinations
|
Off |
On |
 |
|

Usage
This table shows you up to the top four SNF destinations for your selected physician's patients. At a glance you can see if your agency is in the top four agencies receiving patients treated by the selected physician.
Where can I find this metric?
The complete table of all SNFs that admitted patients treated by the selected physician can be found under the Destinations tab on the Analyze page for the selected physician.
Section 2 - Our Agency Relationship
Overview
![]() To orient you to the content in this section of the Sales Spotlight tab there are four critical features you must know. After we present these four, we will analyze the metrics.
To orient you to the content in this section of the Sales Spotlight tab there are four critical features you must know. After we present these four, we will analyze the metrics.
![]() Diagnoses - The metrics in this section are based on different patient populations distinguished by diagnoses. In the image below, the blue boxes surround the metrics related to these different populations. The top box contains metrics for patients with all diagnoses, that is, all patients. The middle box contains metrics only for Circulatory System Patients. The bottom box, Injury and Poisoning.
Diagnoses - The metrics in this section are based on different patient populations distinguished by diagnoses. In the image below, the blue boxes surround the metrics related to these different populations. The top box contains metrics for patients with all diagnoses, that is, all patients. The middle box contains metrics only for Circulatory System Patients. The bottom box, Injury and Poisoning.
All diagnoses will be included for every physician, other diagnoses will be included if that diagnosis represents greater than 15% of the physician's patients
![]() For more information on the Trella Health Diagnostic Groupings, click here.
For more information on the Trella Health Diagnostic Groupings, click here.
![]() Metrics - There are three metrics included for each diagnosis set: (Green boxes from image below.)
Metrics - There are three metrics included for each diagnosis set: (Green boxes from image below.)
- 12-month Risk Adjusted Total Cost of Care following SNF (The image shows 6-month, but this has been updated.)
- 30-Day Readmission Rate
- Average Medicare Days per Stay

All three metrics are displayed for each diagnosis displayed.
![]() Conversation Starter Toggle - There are two modes for presenting the included metrics. In sum, with the Conversation Starters toggle off, you can see the featured metric with trends and comparisons. With the Conversation Starters toggle on, the comparison is stated in a sentence.
Conversation Starter Toggle - There are two modes for presenting the included metrics. In sum, with the Conversation Starters toggle off, you can see the featured metric with trends and comparisons. With the Conversation Starters toggle on, the comparison is stated in a sentence.
|
Conversation Starters Off |
Conversations Starters On |
|
|
|
| At a glance metrics | Comparisons turned into a sentence |


![]() Comparisons - All comparisons are made between the top three agencies for the selected physician. If there is not a favorable comparison for My Agency, a comparison will be made with the state/county benchmarks.
Comparisons - All comparisons are made between the top three agencies for the selected physician. If there is not a favorable comparison for My Agency, a comparison will be made with the state/county benchmarks.
Understanding the Metrics
Twelve-Month Risk Adjusted Total Cost of Care following SNF
|
Conversation Starters Off |
Conversations Starters On |
|
|
|
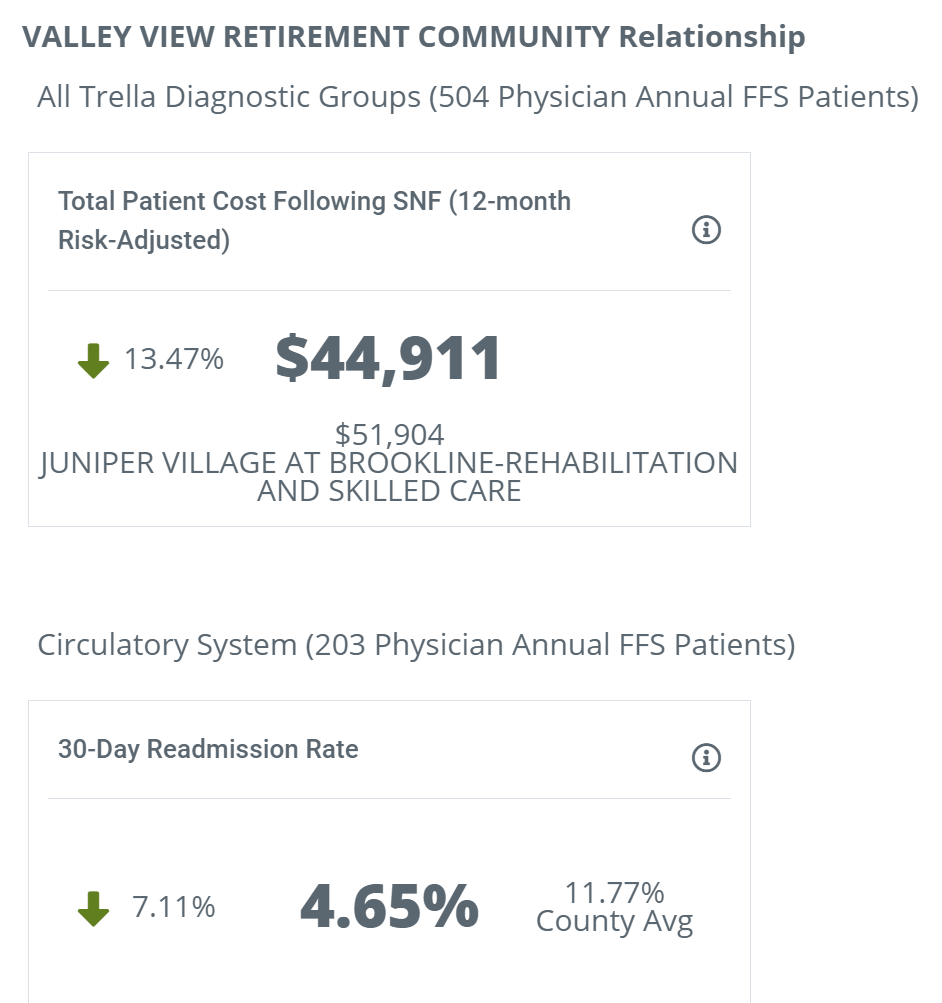

Definitions
This metric is an average cost of care for medical expenses for patients after discharge from my chosen agency. The three different diagnostic groups showcase the following:
- Each different diagnosis set has its own metric for a total cost of care.
- Trends - to the left of each cost is a colored arrow that shows the percentage of cost difference against the listed competitor or average.
- For "All Diagnoses" My Agency has costs 13.47 percent lower than the listed competitor, Normandie Ridge.
- For circulatory patients, My Agency's costs are 4.65 percent lower than the competitor Manorcare. These advantageous metrics are indicated with a green arrow, pointing down.
- Conversation Starters - With the toggle on, these comparisons are presented in a sentence format.
Calculation
The following details will help clarify how we calculate the metrics in this column:
- We calculate the total cost of care for all patients who were discharged from "My Agency" who were treated by the selected physician within the three months prior to SNF admission. We then create an average for this body of patients.
- The discharge must occur during the one year reporting period. This reporting period is pushed back one year prior to the current data set in order to allow time from the discharge to calculate subsequent expenses.
- The total cost for each patient is drawn from all claims submitted in the 6 month period subsequent to SNF discharge. The included costs are included in the image below under Where can I find this metric?
- We use Risk adjusted metrics to make the comparisons meaningful.
Where can I find this metric?
The Total Patient Costs Report table in the Reports section of Marketscape will allow you to compare post home health care costs agency by agency. That table allows you to slice the metrics in numerous ways.

30-Day Readmission Rate
|
Conversation Starters Off |
Conversations Starters On |
|
|
|
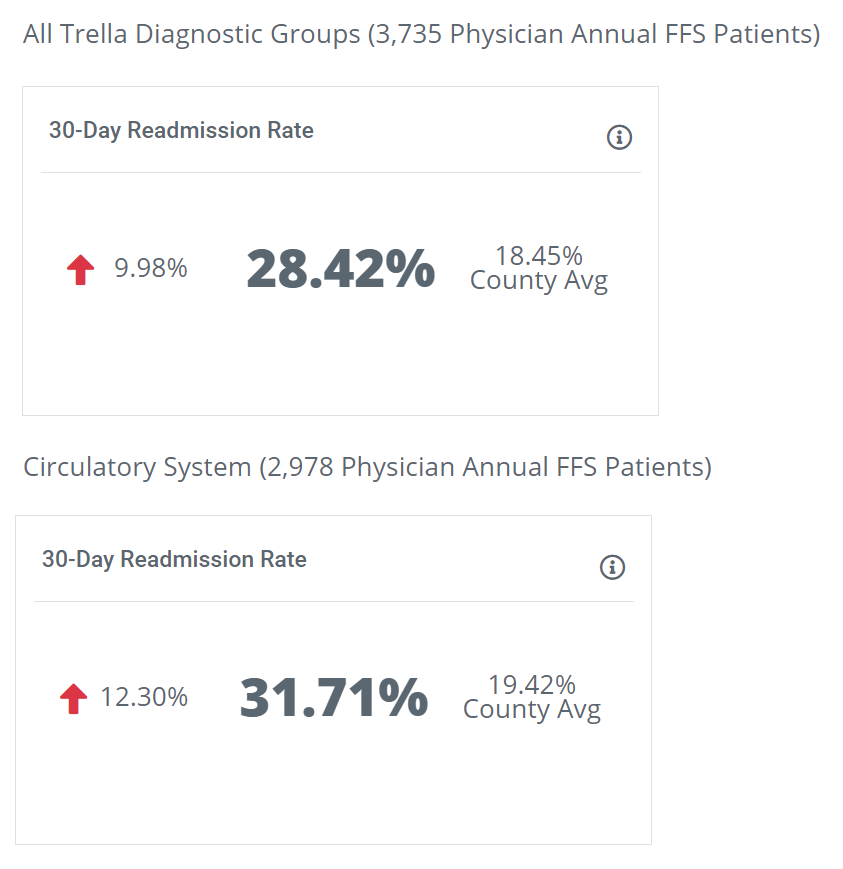
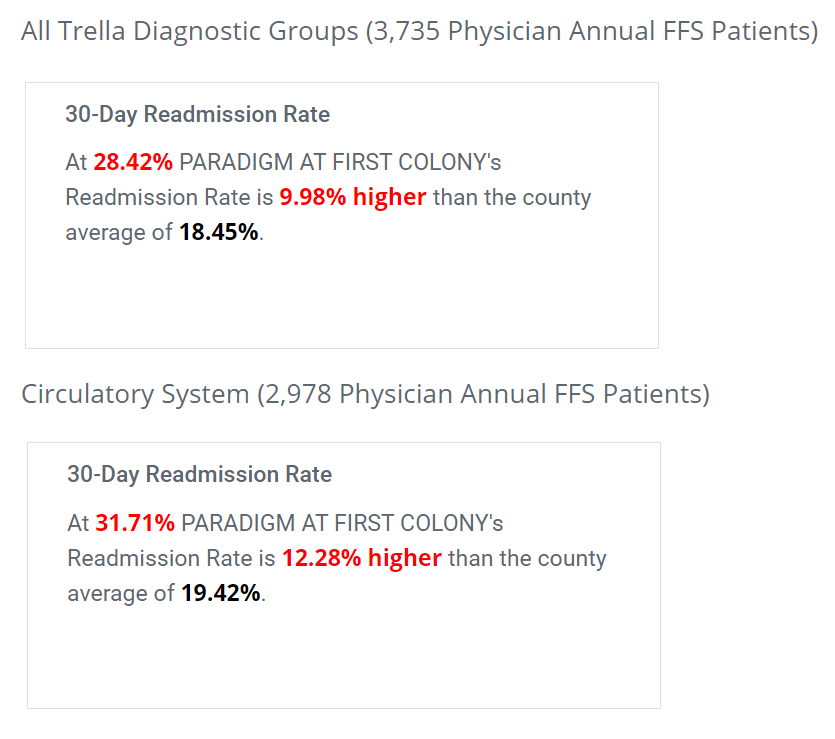
Definition
This metric is the rate at which My Agency's patients were discharged from an inpatient setting, were newly admitted to My Agency, and were subsequently readmitted to any hospital within 30 days of the first inpatient discharge.
To the left of the metric is an arrow that indicates my agencies performance against the county average. In this case, all of the performance metrics are unfavorable and are indicated by a red arrow and the percentage difference from the county average.
If this metric is not favorable against a competitor or against the state average, this is a call to action for your agency.
If the metric was favorable, this would be indicated by a down arrow to the left of the main metric and a comparison below.
![]() Calculation
Calculation
This is the percentage of all patients discharged from an Inpatient stay and admitted to home health within 30 days who were admitted back to inpatient care within 30 days of the initial discharge.
Numerator - count of patients discharged from inpatient care who entered the chosen home health agency and who were re-admitted to inpatient care within 30 days of initial discharge
Denominator - count of patients discharged from inpatient care who entered the chosen home health agency within 30 days
Where can I find this metric?
In addition to the Sales Spotlight email, you can find this metric:
- On the Explore page, in the row for My Agency, under the header Readmission Rate: 30-days.
- On the Analyze page for My Agency, under the Insights tab.
- On the Analyze page for My Agency, under the Operational tab in the table, SNF Agency's Summary. The metric is Readmission Rate: 30-days
- On the Analyze page for My Agency, under the Quality tab in the table, Readmission Rate table in the All row at the bottom under All Acuities - This SNF.
![]() For more information, see Readmission Rates.
For more information, see Readmission Rates.
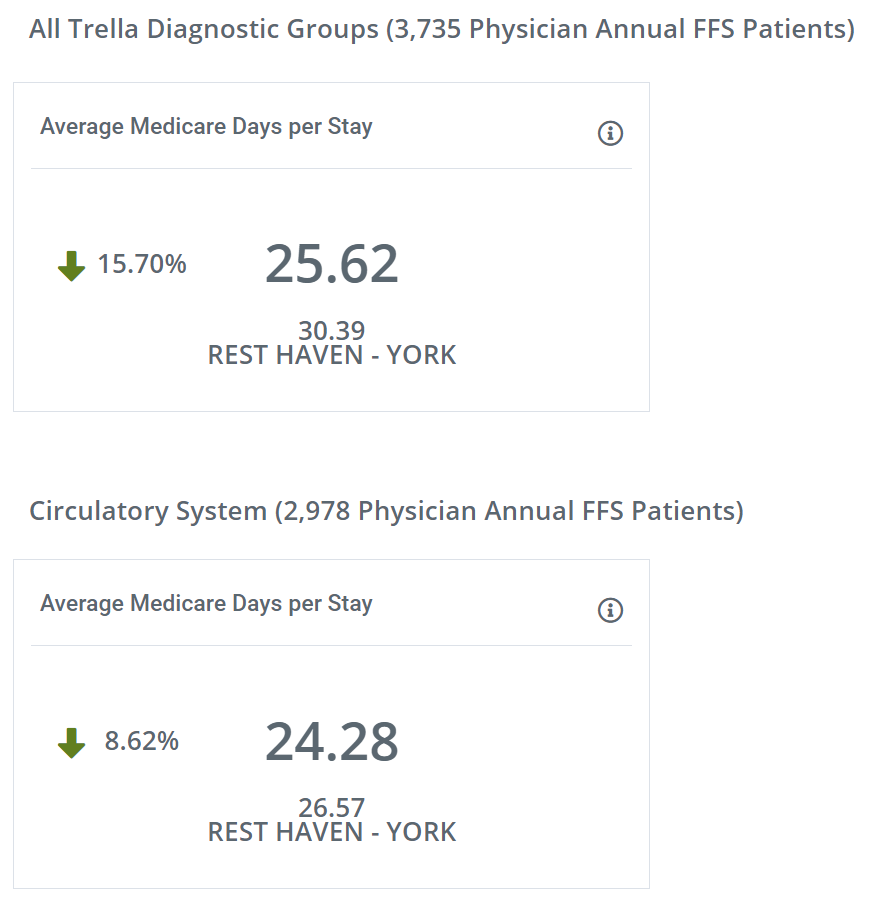
Average Medicare Days per Stay
|
Conversation Starters Off |
Conversations Starters On |
 |
|
Definition
This metric is the average count of patient days spent at my chosen facility.
- Each different diagnosis set has its own metric for the count of patient days.
- Trends - to the left of each cost is a colored arrow that shows the percentage of cost difference against the listed competitor or average.
- For "All Diagnoses" My Agency has an average patient days of 25.62, which is 15.70 percent lower than the listed competitor - Rest Haven.
- For circulatory patients, My Agency has an average patient days of 24.28, which is 8.62 percent lower than the listed competitor - Rest Haven.
- Conversation Starters - With the toggle on, these comparisons are presented in a sentence format.


Comments
0 comments
Article is closed for comments.